Advanced SIMPLIS Training
Advanced SIMPLIS Training
|
To download the examples for Module 2, click Module_2_Examples.zip
In this Topic Hide
How "Per Cycle" Probes can shed light on important details of the converter behavior.
In switching systems, many important control variables, such as duty cycle or switching frequency, are adjusted once per switching cycle. For converter topologies with variable frequency operating modes, it is desirable to plot the frequency of the converter vs. time. The vertical value will be constant for each switching period and change at every switching edge. Consequently, it appears as a stepped waveform. If the converter has a constant frequency, the curve showing the per-cycle frequency would be a flat line.
Open the schematic 2.4_SelfOscillatingConverter_POP_Tran.sxsch
Run the simulation.
Using the keyboard shortcut Ctrl+P
or from the schematic menu, select Probe
More Probe Functions... to open the tree selection dialog.
Result: The tree selection dialog opens, displaying
the advanced probing options:
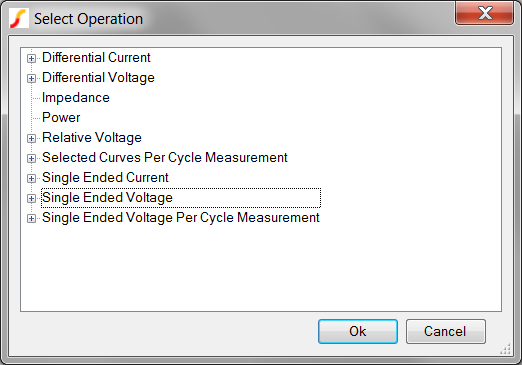
Double click on the last item - Single
Ended Voltage Per Cycle Measurement.
Result: The tree expands to show the two probe
functions in this category.
Select the Per Cycle Frequency
item. The dialog should now be configured as below:
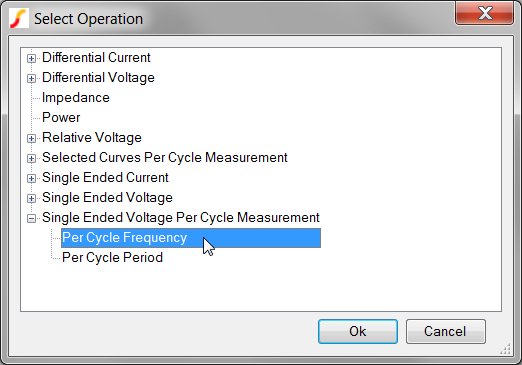
Click Ok.
 |
The program now expects you to select the node on the schematic
for which you want to plot the Per Cycle Frequency curve. In the bottom
bar of the schematic there is a message:

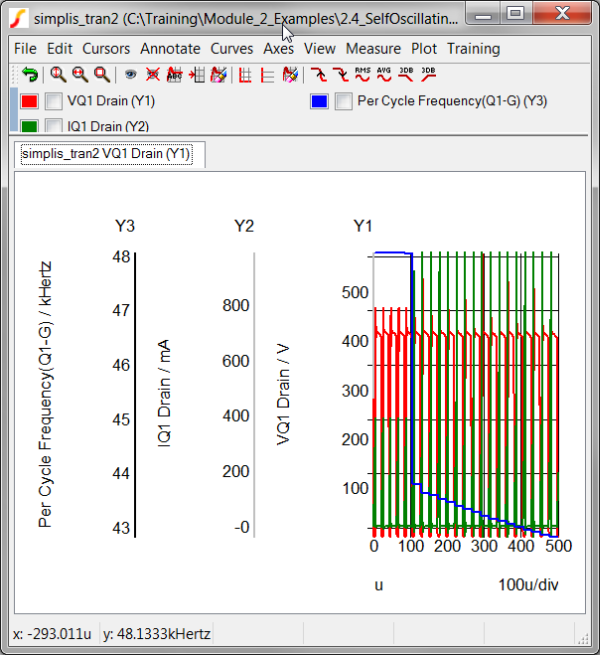
Move the mouse cursor over the gate of the main converter MOSFET Q1.
Left click.
Result: The Per Cycle Frequency of the Q1 gate
drive voltage is plotted on a new axis:
To move the curves to individual grids, execute the graph menu Curves Stack All Curves. The curves are moved to three axes.
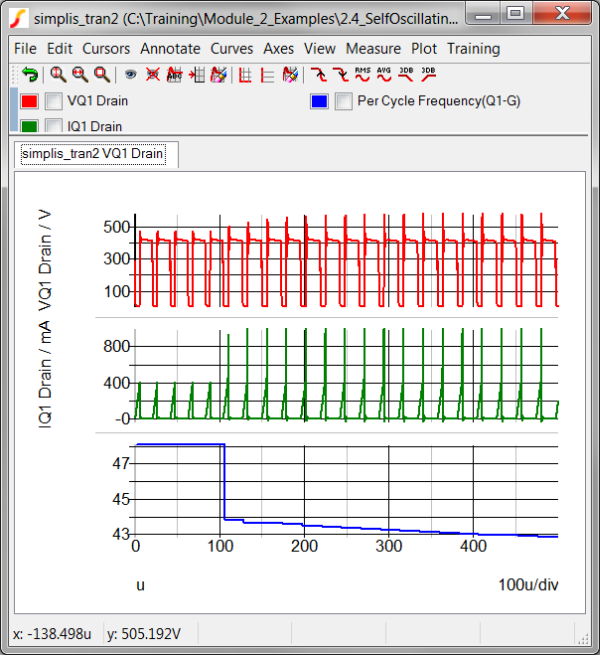
In the above graphs, you can both visualize and easily measure the frequency of the converter during the load step. When you look at the POP analysis in detail, you will see just how powerful this probe feature is.
In the design of switching power systems, you often would like to know a single value of a curve every switching cycle. For example, the duty cycle of the converter has a single value every switching period. Other example measurements which are single valued per switching cycle include:
In this exercise, you will plot the per-cycle mean value of the output voltage curve. These curve functions operate a little differently than the previous example. The previous example plotted the frequency of a curve, using the same curve to define the edges where the vertical, or y-values will change. This works because the gate curve has very distinct edges which define the switching interval. The output voltage curve differs from the gate curve in that the edge information is not easily accessible in the waveform. For a curve which is devoid of any edge information, SIMetrix/SIMPLIS needs two curves to perform the operation:
The curve to perform the measurement on. In this case, the output voltage curve.
An edge source to define the edge transitions where the measured value will change.
Since two curves are being operated on, these measurements require a curve to be selected on the graph viewer. Here is how to plot the Per Cycle Mean value of a curve:
You will start where the last example left off. If you haven't run the simulation,
It will be helpful to plot the output voltage curve from which you are generating the new Per Cycle Mean curve.
From the schematic menu, select Probe - Voltage (New graph sheet)...
Move the mouse over the output voltage Vout.
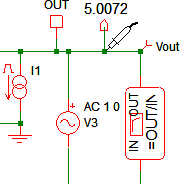
Left click.
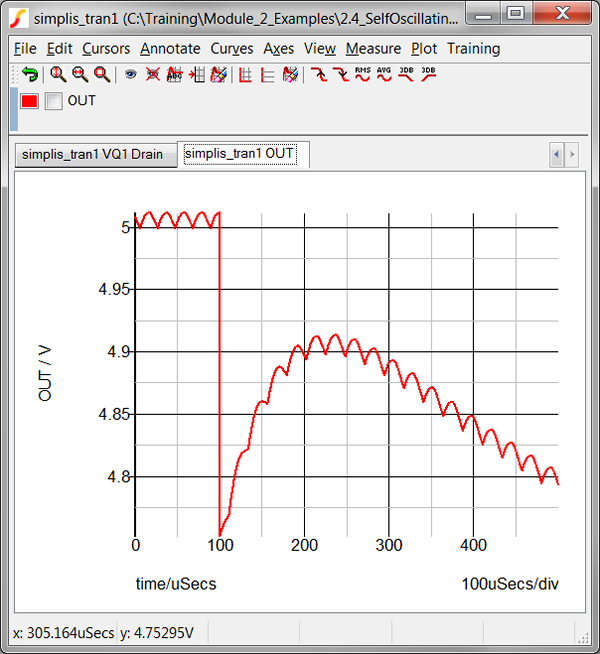
Result: A new graph tab is opened with the
output voltage curve from the Transient analysis. The curve is
labeled OUT in the graph legend. This is because the random probing
reads the schematic net name, not any probe which is connected
to the net.
Click on the OUT curve
in the legend to select the curve.
Result: The check box next to the OUT name
should be checked.
Use the keyboard shortcut Ctrl+P
or from the schematic menu, select Probe
More Probe Functions... to open the tree selection dialog.
Result: The tree selection dialog opens, displaying
the advanced probing options.
Double click on the Selected Curves Per Cycle Measurement.
Select the Per Cycle Mean of
Selected Curves.
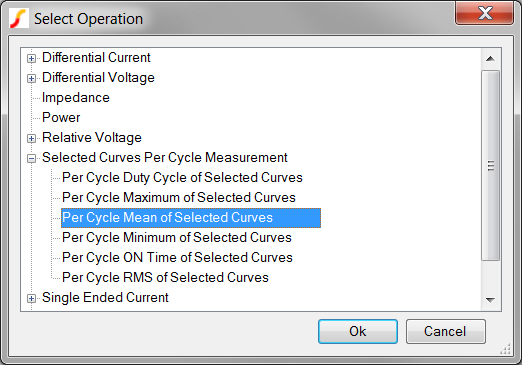
Click Ok.
|
The program now expects you to select the node on the schematic
for which you want to plot the Per Cycle Frequency curve. In the bottom
bar of the schematic there is a message:
Move the mouse cursor over the gate of the main converter MOSFET Q1.
Left click.
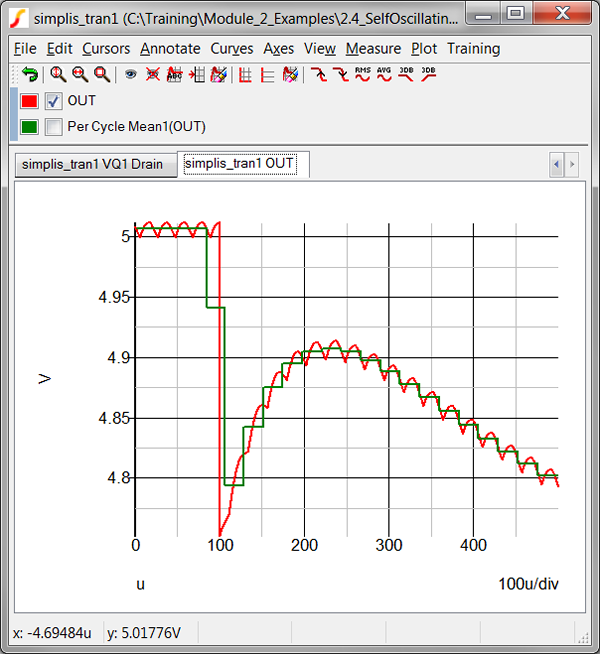
Result: The Per Cycle Mean value of the output
voltage is plotted on the same axis as the OUT
curve.
Per Cycle Probes give a unique view into circuit operation by plotting these per-cycle variables versus time.
© 2015 simplistechnologies.com | All Rights Reserved