SIMPLIS Tutorial
|
In the graph that you ran in Section 3, you had two tabs: simplis_pop1 VOUT (Y1) and simplis_ac5 (Y1).
Note: The number after simplis_pop and simplis_ac might be different on your graph viewer, depending on how many simulations you ran since you started the program.
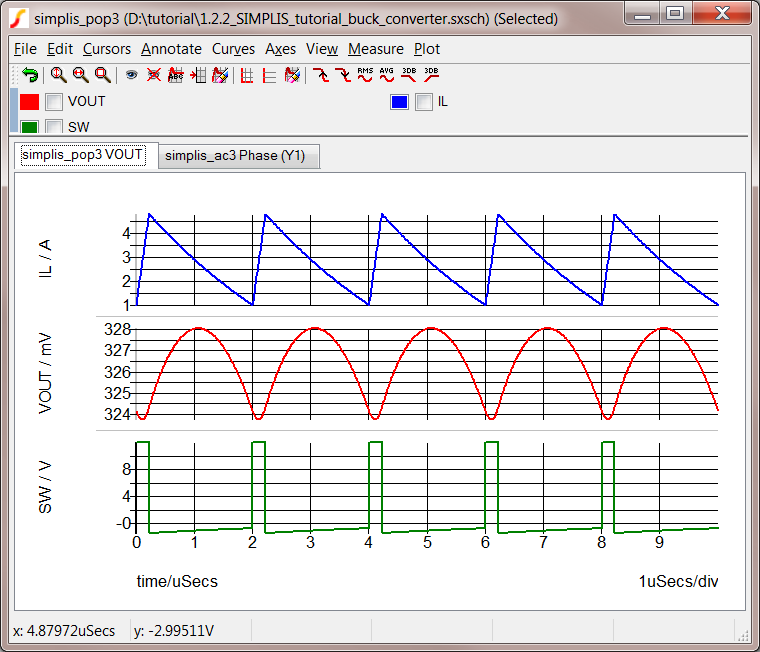
If you click on the simplis_pop tab, you should see three curves on one grid with two axes. Voltages are grouped on one axis, labeled Y1 and the currents on the other, labeled Y2. The program does not let you graph vectors with different physical units on the same axis. Instead, it creates new axes to accommodate the vectors with different physical units.
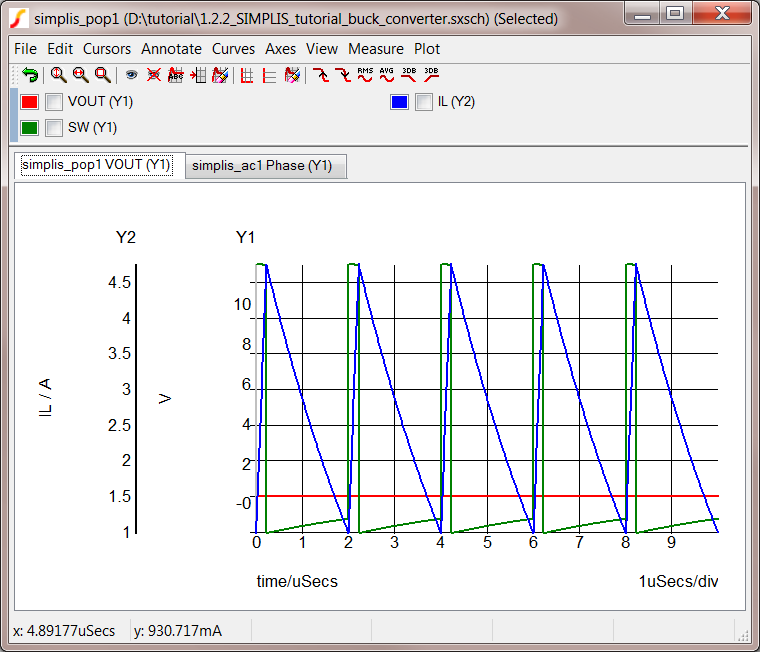
With all three curves on one grid (VOUT in red, SW in green, and IL in blue), the data may be difficult to interpret. For example, the 1.2V output voltage appears to be a flat line when plotted on the same axis as the SW waveform because the relative magnitude of the SW node waveform is much larger.
To separate the waveforms, follow these steps:
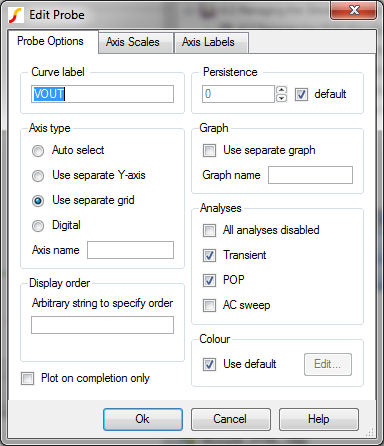
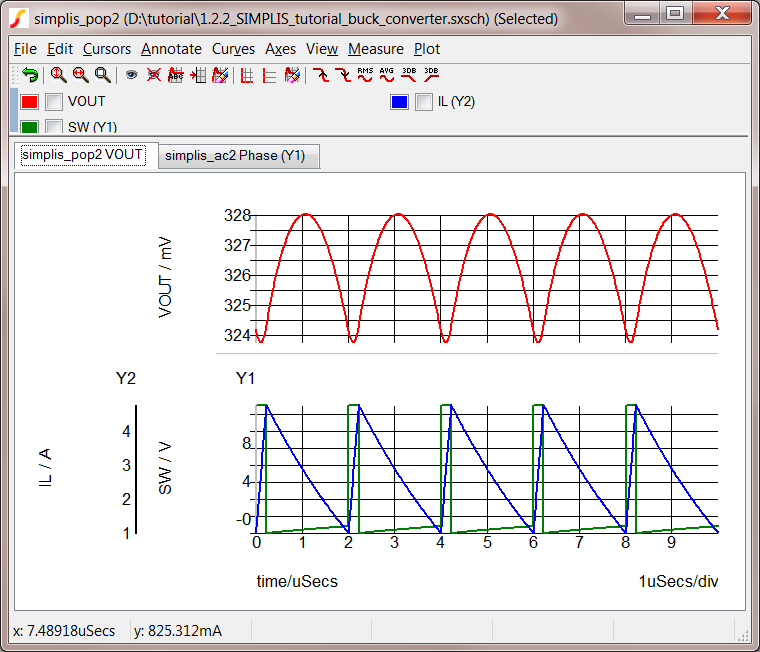
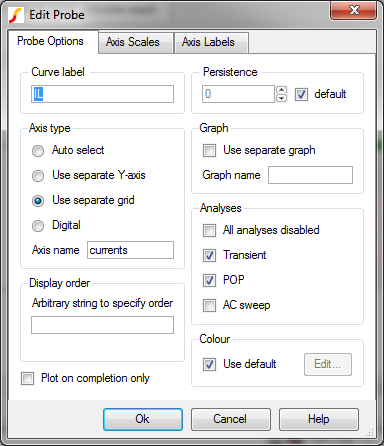
Note: Adding an axis name ensures that the inductor curve does not appear in the same grid with VOUT.
© 2015 simplistechnologies.com | All Rights Reserved