SIMPLIS Multi-step Parameter Analysis
A half-wave rectifier circuit taken from the SIMPLIS Reference Manual provides an example of multi-step parameter analysis. To set up the system to repeat the analysis three times while varying the load resistor, R3, follow these steps:
- Open the schematic example1.sxsch.
- To define the value of R3 as an expression relating to a parameter, select and right click on R3 and from the pop-up menu, select Edit/Add Properties.
- In the Edit Properties dialog box, double click VALUE and change the current value to
the following:
{r3_value}Note: You could also use R3. - Click Ok twice to return to the schematic.
- From the menu bar, select .
- Enter the following values as shown below:
- Parameter name = r3_value:
- Start value = 20:
- Stop value = 100:
- Number of steps = 3
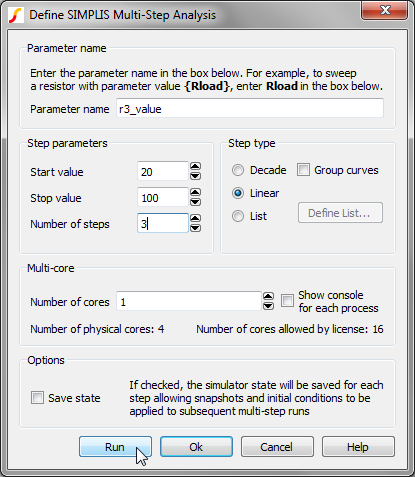
- Click Run. Result: Three simulations are run using the simulation directives setup defined in the Choose Analysis dialog. Each simulation uses a different resistance value for R3. The resistance values are defined as a linear sweep from 20 to 100 with 3 steps. The waveform viewer opens and displays the output curves:
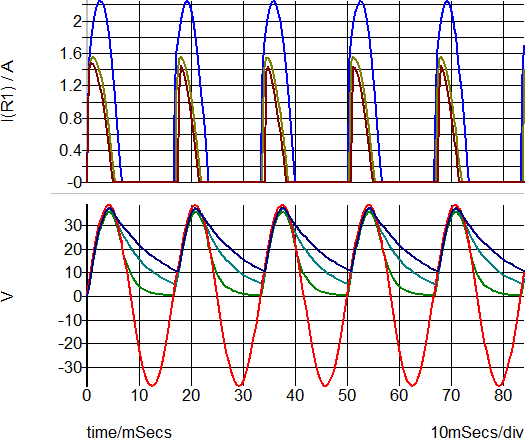 Note: The analysis is repeated three times for the specified values of r3_value: 20, 60 and 100. The resistor value R3 is defined in terms of r3_value which steps R3 through that range.
In most cases, you will step just one part in a similar manner as described above, but you can also use the parameter value to define any number of part values or model values.
If you now run a normal single analysis, you will find that SIMPLIS reports an error because it is unable to resolve the value for R3. This can be overcome by specifying the value using a .VAR control.
- In the F11 window, add the following line to define the value of R3 when a normal
single step analysis is run:
.VAR r3_value=100
Options
The above example illustrates a linear multi-step parameter run. You can also define a decade (logarithmic) run as well as a list-based run that selects parameter values from a list.
To set up a list run, follow these steps in the Define SIMPLIS Multi-step Analysis dialog box.
- Select List from the Step type section.
- Click Define List....
- Enter the values for the list in the dialog box.
- Click Run.
The Group Curves check box controls how graphs are displayed.
- If unchecked, curves for each run will have their own legend and curve colour.
- If checked, curves will all have the same colour and share a single legend.