4.0 Managing Simulation Output
In this section of the tutorial, you will learn how to configure the fixed probes to make the graph easier to read by doing the following:
- Separate the waveforms onto individual grids and change the vertical order of the grids.
- For each curve, change the number of simulation runs displayed on the waveform viewer.
- Interactively make scalar measurements on the curves after the simulation completes.
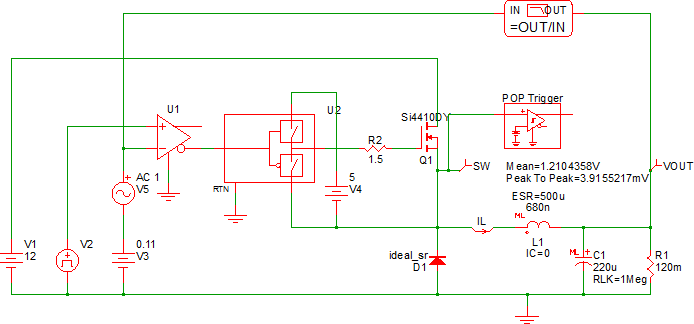
- Add scalar measurements to the fixed probe symbols. These measurements are automatically made after each simulation run.
After you complete this chapter, the schematic should like the following: