Measuring the Switching Frequency
A number of scalar measurements which DVM automatically makes require knowledge of the actual switching frequency of the converter. In particular, the test objectives listed below measure the output voltage and current at the end of the simulation time. These in-regulation measurements require DVM to know the actual converter switching frequency and without this information, the in-regulation measurements are not made. For this reason, a special curve name, DVM Frequency, has been reserved for DVM to find the switching frequency.
- StepLoad() Test Objective
- StepLine() Test Objective
- PulseLoad() Test Objective
- PulseLine() Test Objective
- Startup() Test Objective
- ShortCkt() Test Objective (the DVM Frequency curve applies only when recovery is specified)
The DVM Frequency Probe
When preparing the schematic for simulation, DVM searches for any probe, regardless of type, with a curve label of DVM Frequency. If that curve is found, DVM adds a fixed probe measurement to that probe. Shown below are these results:
- The fixed probe measurement is executed after the simulation completes and annotates the graph with the actual frequency measured during the simulation.
- The curve legend is annotated with a measurement: sw_freq, and this measurement is output as a scalar value in the report.
| Graph | Report |
|
|
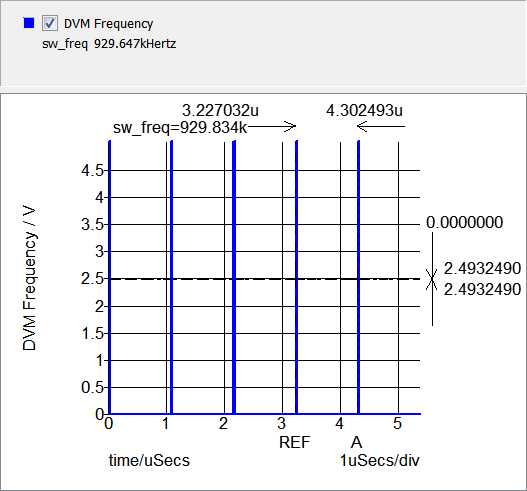
Measurement Definition
The frequency is measured over the last full switching period present in the simulation, taken from rising-edge to rising-edge of the DVM Frequency waveform. The cursors in the graph image below show the time interval over which the frequency is measured.