What SIMPLIS POP Does (and Why it Matters)
The SIMPLIS Periodic Operating Point (POP) analysis excels at finding the steady-state ON-OFF limit cycle of a stable periodic switching system.
Because of its uniqueness to SIMPLIS, POP analysis is one of the more challenging, but also more rewarding aspects of SIMPLIS to master. Understanding how the SIMPLIS POP analysis and the POP algorithm work is critical to receiving the maximum benefit from the SIMPLIS simulation capability. These primary benefits are:
- Saving simulation time to identify errors early in the design process.
- Making AC analysis possible on a time-domain switching circuit.
To reach steady state, POP simulates the system in the time domain by performing these tasks:
- Takes a snapshot of every capacitor voltage and every inductor current at the beginning of each switching cycle.
- Simulates the system for an additional switching cycle, and then takes another snapshot of the system at the beginning of the next switching cycle.
- Takes the difference of each capacitor voltage and each inductor current between these two snapshots, seeking to drive each difference to zero.
In practice, once POP has found the steady state of a switching system, the largest difference between two successive snapshot values for capacitor voltage or inductor current is in the range of 1.0e-10% to 1.0e-13%. These are miniscule errors compared to a typical RELTOL in SPICE of 1.0e-3.
In a system with a reasonable set of initial conditions, the SIMPLIS POP algorithm iteratively seeks the following conditions to arrive at a steady state.
- For each capacitor voltage, the voltage difference from cycle to cycle is nearly zero.
- For each inductor current, the difference in current from cycle to cycle is nearly zero.
- Each logic device has the same state at the beginning of each switching cycle.
- Each controlled switch has the same state at the beginning of each switching cycle.
This SIMPLIS POP algorithm works best in finding the steady-state operating point of switching time-sampled systems such as the following:
- Switching power supplies
- Phase-locked loops
- Class D amplifiers
- Switched capacitor filters
Many of these systems use a feedback loop for control. If the system with its feedback loop is unstable and has no steady-state operating point, then the POP analysis will not be successful. As long as this feedback system is stable, the POP analysis can be successful.
Why SIMPLIS POP Matters
In real life, when you characterize a switching system such as a switching power supply, more than 95% of the measurements begin with the system in steady state operation. The SIMPLIS POP analysis quickly drives a switching circuit into a steady state. Once the system reaches steady state, the system can be disturbed and the resulting system response can be measured.
In the majority of system measurements, the reference point for the measurement is the initial steady-state periodic operating point. Since in a typical design project, the designer runs several thousand simulations, being able to reduce the amount of CPU time required to get the system into steady state pays off in time saved for the engineer. If the time to reach steady state can be reduced from 10 minutes to 10 seconds, the time savings runs into hundreds of hours over the life of a project.
Because SIMPLIS can run so many simulations in a relatively short period of time, the SIMPLIS POP analysis makes serious simulation analysis feasible for switching power supply systems. Without POP, only a cursory set of simulation analyses can be run in the practical time allowed. POP, however, makes possible exhaustive system performance characterization during the design process. As a result, the majority of design errors can be detected very early in the design process. Detecting errors before the design has been committed to hardware means that the design errors are least expensive in time and money to correct.
Because of the speed and accuracy with which the piecewise linear SIMPLIS POP analysis can find steady state means, SIMPLIS AC analysis is possible based on the following two-step process:
- While performing a time-domain transient simulation with the system in steady state, an extremely small AC signal injected into the system assures that nothing disturbs the system in such a way that inadvertently saturates any device in the signal path.
- The system response to the injected signal is then measured again in the time domain. The accuracy of SIMPLIS is so high, that even with a very small injected AC signal, this system response can be measured with an extremely high signal-to-noise ratio.
Example #1 : PFC Converter w/ DC Input
A Power Factor Corrector (PFC) converter dramatically shows the amount of time POP can save when simulating a converter to steady-state. Because this converter has a slow control loop response time, the transient simulation must be run for a long time to allow the converter to settle into steady-state. The POP analysis can reduce the time required to reach steady-state by orders of magnitude.
A zip archive of the PFC converter schematics and supporting files can be downloaded here: simplis_500_pfc_examples.zip. The zip file contains four schematics which are identical, except for the analysis modes and the initial conditions. These models are larger than the SIMetrix/SIMPLIS Intro size restrictions. For an evaluation license for the full version of SIMetrix/SIMPLIS, contact SIMPLIS Technologies.
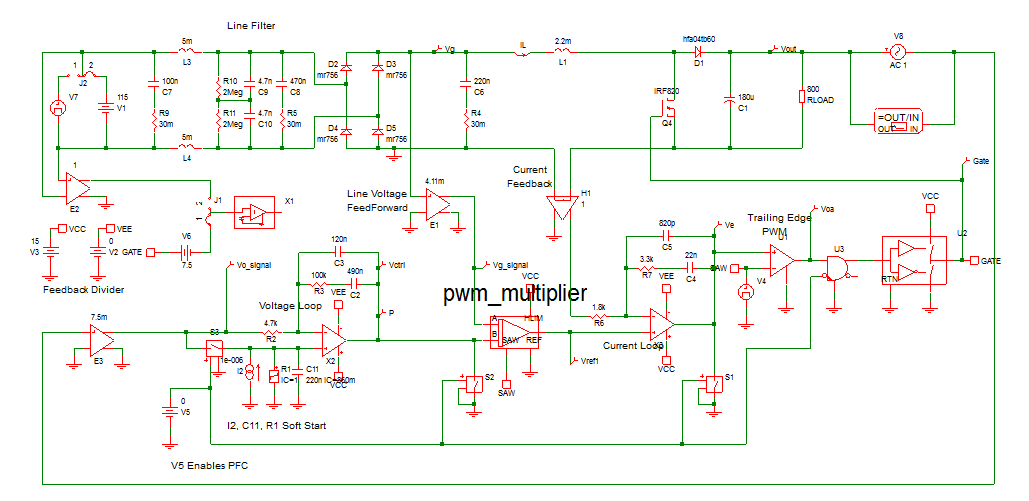
The PFC converter examples have the following characteristics:
- Continuous Conduction Mode
- Power output of 200W
- Output Voltage of 400V DC
- Input Voltage of 115V DC
- Control Loop-Bandwidth of Approximately 11Hz
The PFC converter schematic is pictured below:
Transient Analysis
The first simulation run on this converter is a SIMPLIS transient analysis, where the converter is simulated through a soft-start cycle and the output voltage is allowed to settle. The simulation stop time is set to 1s, which is long enough to allow the output voltage to settle after the soft-start is complete.
The converter has relatively few large energy storage elements, primarily composed of the output capacitor, boost inductor, soft-start capacitor and voltage loop compensation capacitors. Because the converter transitions through a soft-start cycle, these major energy storage elements are initialized to the following values:
| Circuit Element | Initial Condition |
| Output Capacitor | 163V |
| Boost Inductor | 0A |
| Soft-start Capacitor | 860mV |
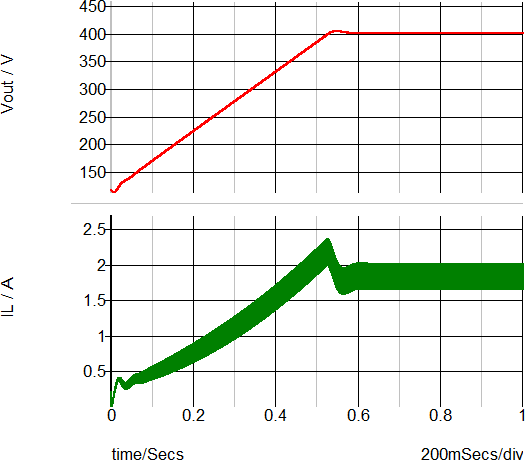
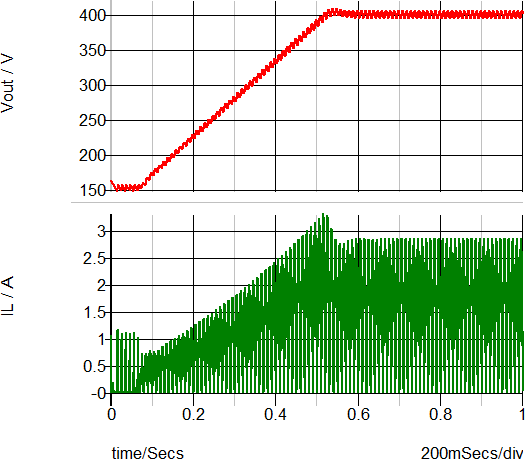
After setting the initial conditions, the converter is simulated using the SIMPLIS transient analysis. This particular converter took 2 min., 28 seconds of elapsed time to reach the 1s simulation end time. The waveforms below show the output voltage tracks the soft-start ramp in a controlled manner, there is a small overshoot, then the converter settles into steady state with an output voltage of 400V. Most of the elapsed time is wasted in bringing the slow control loop to the final, steady-state values.
| DC-Input Transient Analysis Waveforms |
|
| Elapsed Time : 158s (2min , 28 s.) |
POP Analysis
The SIMPLIS POP analysis greatly speeds up the simulation time by actively forcing the converter into a steady-state. In this example, the initial conditions for the three main energy storage elements ware taken from the steady-state portion of the transient simulation data. These initial conditions are:
| Circuit Element | Initial Condition |
| Output Capacitor | 400V |
| Boost Inductor | 1.66A |
| Soft-start Capacitor | 3V |
| Compensation Capacitor C2 | 920mV |
The initial condition for the voltage loop compensation capacitor C2 is added to ensure the converter is in a switching state when the simulation starts. The POP analysis requires the circuit to continuously switch in a periodic manner, and without this initial condition, this particular model can stop switching, which causes POP to fail.
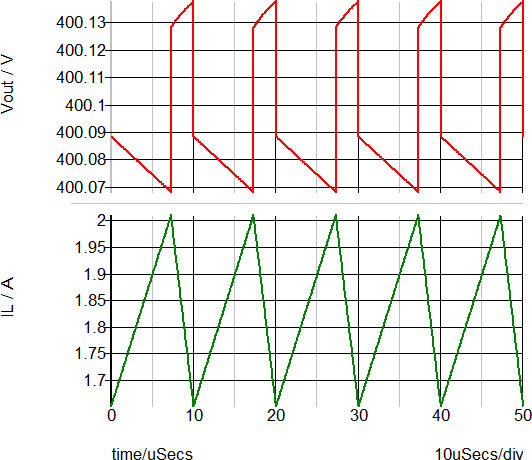
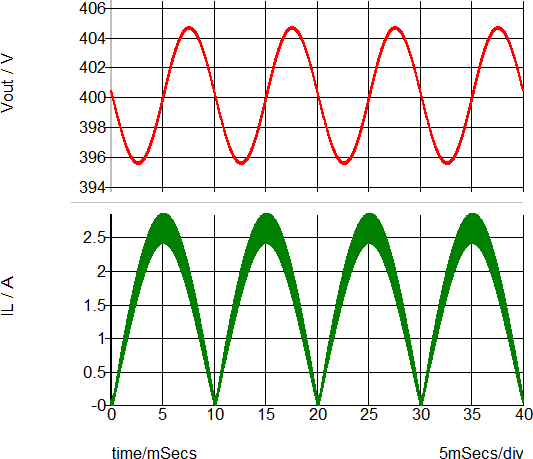
The steady-state waveforms for the POP analysis are shown below. Note the output voltage has converged to a steady-state and there is no visible settling on the waveforms. This simulation only took 1 second to complete, compared to the transient example which took 2min., 28 seconds.
| DC-Input POP Analysis Waveforms |
|
| Elapsed Time : 1s. |
AC Analysis
One of the greatest rewards for designing a converter model which succeeds in SIMPLIS POP analysis is the ability to run an AC analysis directly on the transient model . There is no need to derive a AC model for the topology under study as SIMPLIS provides the AC response for the time-domain circuit model.
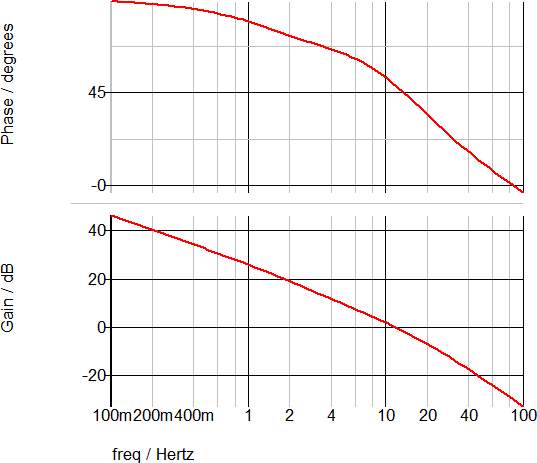
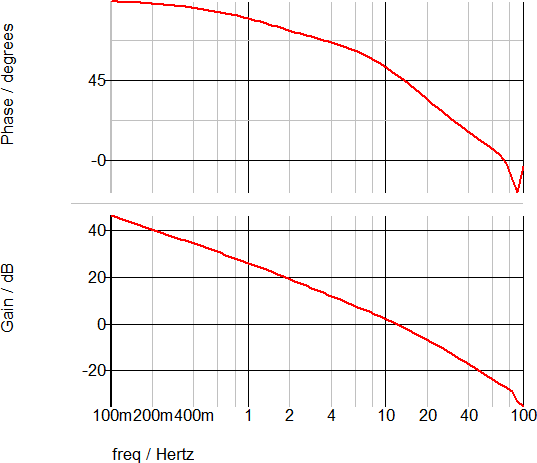
The overall loop gain of the PFC converter is shown below. This simulation took 1second to run after a successful POP analysis.
| DC-Input AC Analysis Waveforms |
|
| Elapsed Time : 1s. |
From the AC analysis, the PFC converter has the following control loop measurements:
| Measurement | Value |
| Loop Crossover Frequency | 11.6 Hz |
| Phase Margin | 48.6 degrees |
| Gain Margin | 29.9 dB |
Summary of Elapsed Time
A summary of the elapsed time to reach steady-state for each DC Input Analysis mode is shown in the table below.
| Analysis Mode | Elapsed Time |
| Transient | 158s, ( 2 min. 28 s. ) |
| POP | 1s. |
Example #2 : PFC Converter w/ AC Input
The example zip file simplis_500_pfc_examples.zip contains two schematics configured for an AC line input. One schematic ( simplis_500_pfc_ac_input_tran_example.sxsch ) is configured to run the transient analysis, and the other ( simplis_500_pfc_ac_input_pop_ac_example.sxsch ) for a POP analysis.
Converters with AC inputs will only POP under very specific circumstances. These requirements are:
- The switching frequency is an exact harmonic multiple of the input line frequency.
- The circuit has a reasonably close set of initial conditions.
- The POP trigger source is the AC line source.
If these requirements are met, the POP analysis will be successful and the resulting AC analysis can be run on the model. In the circuit examples, the first condition is met by choosing the line frequency to be 50Hz. The switching frequency is 100kHz, which is effectively the 2000th harmonic of the line frequency.
Because the POP trigger frequency is 2000 times lower than the DC input case, the simulations with an AC input source take considerably longer to complete than the DC input case. Even so, the POP analysis is faster than the transient ( on either AC or DC inputs ) and, after the POP analysis is successful, the SIMPLIS AC analysis can be performed on the converter model, with an AC input line.
Transient Analysis
As with the DC input case, the major energy storage elements are initialized.
| Circuit Element | Initial Condition |
| Output Capacitor | 163V |
| Boost Inductor | 0A |
| Soft-start Capacitor | 860mV |
| Compensation Capacitor C2 | 970mV |
After setting the initial conditions, the converter is simulated using the SIMPLIS Transient analysis. This particular converter took 2 min., 18 seconds of elapsed time to reach the 1s simulation end time. The waveforms below show the output voltage tracks the soft-start ramp in a controlled manner, there is a small overshoot, then the converter settles into steady state with an output voltage of 400V. Most of the elapsed time is wasted in bringing the slow control loop to the final, steady-state values.
| AC-Input Transient Analysis Waveforms |
|
| Elapsed Time : 148s (2min , 18 s.) |
POP Analysis
After running the transient analysis, the SIMPLIS POP analysis is run on the model. In this example, the initial conditions for the three main energy storage elements ware taken from the last data point of the transient simulation data. These initial conditions are:
| Circuit Element | Initial Condition |
| Output Capacitor | 400V |
| Boost Inductor | 40mA |
| Soft-start Capacitor | 3V |
| Compensation Capacitor C2 | 880mV |
The steady-state waveforms for the POP analysis are shown below. Note that instead of POP using the switching frequency as the POP trigger, the AC line frequency is used. As with the DC input case, the output voltage has converged to a steady-state and there is no visible settling on the waveforms. This simulation only took 43 seconds to complete, compared to the transient simulation on the same model, which took 2min., 18 seconds.
| AC-Input POP Analysis Waveforms |
|
| Elapsed Time : 43s. |
AC Analysis
The overall loop gain of the PFC converter operating under AC line input is shown below. This simulation took 1 min., 46 seconds to run after a successful POP analysis. Note that this simulation time is much longer than the DC input case because the converter is using the line frequency of 50Hz as the POP trigger source.
| DC-Input AC Analysis Waveforms |
|
| Elapsed Time : 106s. |
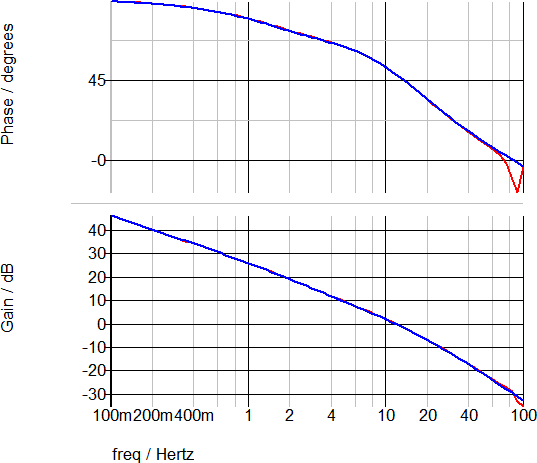
Comparison of AC Analyses for AC and DC Inputs
The AC Analysis results for a DC and an AC line source are nearly identical.
| AC and DC-Input AC Analysis Waveforms |
|
|
Comparison of Elapsed Time for AC and DC Inputs
A summary of the total elapsed time to reach steady-state for each line source type and analysis mode are shown in the table below.
| Line Source | Analysis Mode | Elapsed Time |
| DC | Transient | 128s. |
| DC | POP | 1s. |
| AC | Transient | 118s. |
| AC | POP | 43s. |