PerCycleTiming Function
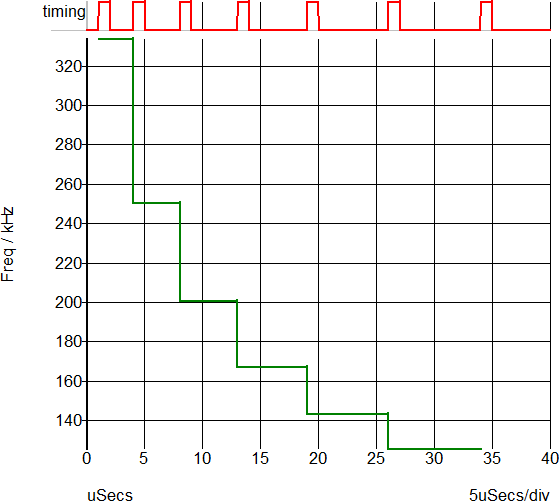
Processes the input vector measuring the Frequency, Period, Duty Cycle, On-Time, or Off-Time on a per-period basis. The returned vector contains the measured value of the input vector, such as the Duty Cycle, plotted against the original x-axis value, for example, time. The return vector is either "stepped" or smooth. A stepped return vector will have vertical discontinuities at the beginning and end of each period found in the input vector, with the value being constant during the input vector period. A smooth return vector will have a single data point per input vector period, located at the mid-point of the input vector period.
Argument 3 is optional and specifies the output curve type, if this argument is not passed, the default value will be "stepped". The stepped return vector will change value only at the edges detected in the input vector. The value will be constant during the entire period. A smooth input vector will have a single data point at the mid-point of the input vector period. The points will be connected resulting in a smooth curve from one period to the next.
Argument 4 specifies edge direction. If set to 0 either direction will be accepted. If set to 1 only positive edges will be detected and if set to -1 only negative edges will be detected. This argument is only used for the period and frequency measurements. All other measurements will be processed with the Direction argument set to 1, indicating positive edges.
Arguments
| Number | Type | Compulsory | Default | Description |
| 1 | real array | Yes | Input vector | |
| 2 | string | Yes | Measurement to make | |
| 3 | string | No | stepped | Type of return curve |
| 4 | real | No | 1 | Direction |
Argument 1
The vector to return the Frequency, Period, Duty Cycle, On-Time, or Off-Time values for. The timing edges are found from this vector using a threshold of ???MATH???\frac{maximum+minimum}{2}???MATH???. For this reason, it is important that the vector have a uniform amplitude and is noise-free around the trigger threshold.
Argument 2
A pre-defined measurement function to make, one of:
- frequency
- period
- duty-cycle
- on-time
- off-time
Argument 3
Determines the type of return curve, one of:
- stepped
- smooth
Argument 4
Determines the edges used to process the input vector, one of:
- -1: Falling edges
- 1 : Rising edges
- 0 : Both Rising and Falling Edges
Returns
Return type: real array
A real vector of the measured values from the input vector, with reference values according to the third argument. The return vector is formatted to be plotted directly on the waveform viewer.
Example
PerCycleTiming( :Gate , 'frequency' )will generate a vector which, when plotted on the waveform viewer appears like:
| ▲Function Summary▲ | ||
| ◄ PathEqual | PerCycleValue ▶ | |