Annotating a Graph
A number of objects are available to annotate graphs for documentation purposes. These are:
- Curve Marker. A single arrow, line and item of text to identify a curve or feature of a curve
- Legend Box. Box of text that lists all the names of curves currently displayed.
- Text Box. Box containing text message.
- Free Text. Similar to text box but without border and background.
- Caption. As free text but designed for single line heading.
In this topic:
Curve Markers
Placing
To place a curve marker, select menu . A single curve marker should appear in the right hand margin of the graph.
Moving
To move it, place the mouse cursor at the arrow head - you should see the cursor shape change to a four pointed arrow - then left click and drag to your desired location. When you release the marker it will snap to the nearest curve.
Moving Label
To move the text label alone, place the mouse cursor to lie within the text, then left click and drag. You will notice the alignment of the text with respect to the arrowed line change as you move the text around the arrow. You can fix a particular alignment if preferred by changing the marker's properties. See below.
Deleting
First select the marker by a single left click in the text. The text should change colour to blue. Now press delete key or menu .
Editing Properties
Double click the marker's label or select then menu . The following dialog will open:
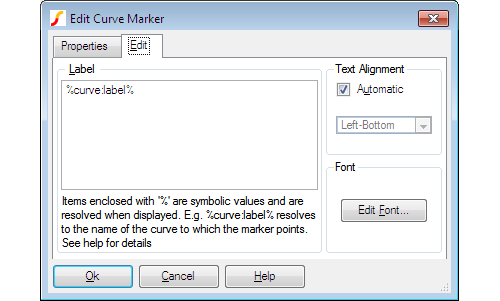
| Label | Text of the marker's label. %curve:label% automatically resolves to the curve's label. If the curve name is edited with menu Curves | Rename curve this value will reflect the change. You can of course enter any text in this box. You can also use expressions in the same manner as for cursor dimensions. See Label in Editing Style or/and Format of Cursor Dimension. |
| Text Alignment | This is how the label is aligned to the arrowed line. If set to automatic the alignment will be chosen to be the most appropriate for the relative position of the label and the arrowhead. Uncheck automatic and select from the list to fix at a particular alignment. |
| Font | Press Edit Font... to change font for text. |
| Snap To Curve | You can switch off the action that causes curve markers to always snap to a curve. Select Properties tab then double click on SnapToCurve item. Select Off. You will now be able to move the curve marker to any location. |
Legend Box
Placing
Select menu . A box listing all the curve names will appear at the top left of the graph.
Moving
Place cursor inside the box and drag to new location.
Resizing
You can alter the maximum height of the box by placing the mouse cursor on it's bottom edge and dragging. The text in the box will automatically reposition to comply with the new maximum height.
Editing Properties
Double click on the box or select then menu . The following dialog will be opened:
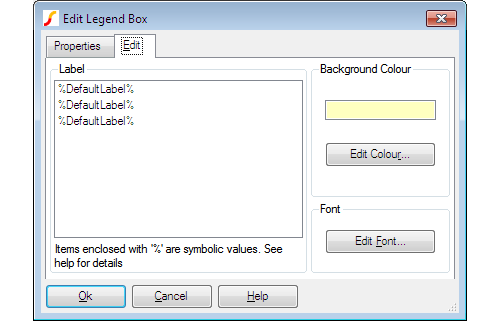 The dialog box options are:
| Label | Lists each label in the box. These are usually %DefaultLabel% which resolves to the name of the referenced curve. To edit, double click on the desired item. You can also enter the symbols %X1% and %Y1% which represent the x and y coordinates of the marker respectively. These can be combined with other text in any suitable manner. For example: 'Voltage @ %X1%S = %Y1%' might resolve to something like 'Voltage at 10u = 2.345'. The values of %X1% and %Y1% will automatically update if you move the marker. You can also use expressions in the same manner as for cursor dimensions. See Label in Editing Style or/and Format of Cursor Dimension. |
| Background Colour | Select button Edit Colour... to change background colour. To change the default colour select menu then select item Text Box. Edit colour as required. |
| Font | Select button Edit Font... to change font. To change the default font select menu then select item Legend Box. Edit font as required. |
Text Box
Placing
Select menu . Enter required text then Ok. You can use the symbolic constants %date%, %time%, and %version% to represent creation date, creation time and the product version respectively.
Moving
Place cursor inside the box and drag to new location.
Editing Properties
Double click on the box or select then menu . A dialog like the one shown for legend boxes (see Placing) will be displayed.
Note when editing the label, you can use the symbolic constants as detailed in above.
Caption and Free Text
The Caption and Free Text objects are essentially the same, the only difference is their initial font size and position.
Placing
Select menu or . Enter required text then Ok. You can use the symbolic constants %date%, %time%, and %version% to represent creation date, creation time and the product version respectively.
Moving
Place cursor inside the box and drag to new location.
Editing Properties
Double click on the box or select then menu . This will open a dialog similar to the one shown for curve markers but without the Automatic option for text alignment.
Graph Symbolic Values
Most graph objects have one or more label properties that can be used to display text on the graph.As well as literal text, these label properties may also use symbolic values enclosed with '%'. These symbolic values return values of other properties belonging to the object. For example curve marker objects have a property called X1 which is always set to the x-location of the curve to which it is attached. So %X1% in a curve marker label will return the x-location allowing it to be displayed on the graph. The X1 property is updated every time the curve marker is moved; the label value is re-evaluated every time the graph is repainted. (Sometimes it is necessary to force a repaint to get labels with symbolic values or/and expressions to update. You can do this by moving another window over the graph or adjusting the size of the window slightly)
Some properties return the ID of another graph object. For example the Curve property returns the ID of the curve to which it is attached. These can be used to access properties of the referenced object. This is done by appending with a ':' followed by the referenced object's property name. For example %curve:label% returns the label property of the curve attached to the curve marker.
This indirect access to graph object properties can be nested to any level although there is probably no good reason for any more than two levels. %curve:xaxis:label%, for example has two levels; %curve% returns the ID of a curve, then %curve:xaxis% returns the id of an axis then %curve:xaxis:label% returns the label property belonging to the axis.
Full documentation is available in Script Reference Manual/Applications/Graph Objects. This lists the available objects and their property names. There is also a sub-heading titled Symbolic Values that explains the above.
However, deducing all the different possibilities for symbolic values, especially the indirect values, requires some effort. For this reason, the following table has been compiled which lists a range of complete symbolic values that are meaningful for use in labels for various objects. This list is not exhaustive, but probably has everything that is useable.
Note that the symbolic variable names, like everything in SIMetrix, are not case sensitive.
| Variable | Description | Can use with |
| %curve:label% | Curve's label | Curve marker |
| %curve:shortlabel% | Curve's label without the groupname suffix that is sometimes displayed | Curve marker |
| %curve:xunit% | Curve's x-axis units | Curve marker |
| %curve:yunit% | Curve's y-axis units | Curve marker |
| %x1% | Curve's x-value at curve marker | Curve marker |
| %y1% | Curve's y-value at curve marker | Curve marker |
| %curve:xaxis:label% | Curve's x-axis label | Curve marker |
| %curve:yaxis:label% | Curve's y-axis label | Curve marker |
| %curve:measurements% | Any measurements assigned to the curve | Curve marker |
| %graph:maincursor:x1% | x-position of main cursor | Anything |
| %graph:maincursor:y1% | y-position of main cursor | Anything |
| %graph:refcursor:x1% | x-position of ref cursor | Anything |
| %graph:refcursor:y1% | y-position of ref cursor | Anything |
| %graph:grouptitle% | Title of initial data group. This is actually the netlist title (first line) and for schematic simulations will be the full path of the schematic. | Anything |
| %graph:sourcegroup% | Data group name that was current when first curve added to graph. E.g. 'tran1', 'dc5' etc. | Anything |
| %curve1:label% | Label for curve attached to crosshair 1 | Dimension |
| %curve2:label% | Label for curve attached to crosshair 2 | Dimension |
| %curve1:shortlabel% | Curve1's label without the groupname suffix that is sometimes displayed | Dimension |
| %curve2:shortlabel% | Curve2's label without the groupname suffix that is sometimes displayed | Dimension |
| %curve1:xunit% | Curve1's x-axis units | Dimension |
| %curve2:xunit% | Curve2's x-axis units | Dimension |
| %curve1:yunit% | Curve1's y-axis units | Dimension |
| %curve2:yunit% | Curve2's y-axis units | Dimension |
| %date% | Date when object created | Textbox, free text, caption, legend box |
| %time% | Time when object created | Textbox, free text, caption, legend box |
| %version% | Product name and version | Textbox, free text, caption, legend box |
Expressions
Graph object labels may contain expressions enclosed in curly braces. These will be evaluated and the result of the evaluation replaces the complete expression and curly braces. Any script function may be used although only a subset are applicable.
The function 'cv()' is particularly useful. cv() returns the data for a curve and you can use this with functions that return a scalar from a vector to attach measurements to curve markers or cursors. Use %curve% as the argument for cv(), i.e.
cv(%curve%)
For example, this will return the RMS value for the curve attached to a curve marker:
{RMS1(cv(%curve%))}
For crosshair dimension objects (the cursor dimensions) use %curve1% or %curve2% instead of %curve%.
The Truncate() function is useful if you want to display a measurement applied to a range marked out by the cursors. So the following example will return the RMS value of the curve attached to a curve marker between the range marked out by the cursors.
{RMS1(Truncate(cv(%curve%),
%graph:refcursor:x1%,%graph:maincursor:x1%))}
You can also use string functions. For example, %graph:title% usually returns the pathname of the schematic. (This is not guaranteed - but this will always be the case if the schematic has been saved and was run using the regular menus). You can use the SplitPath function to obtain just the file name. E.g.:
{(splitpath('%Graph:GroupTitle%'))[2]}
You can use the above in any object including free text, text boxes and captions. (Captions are identical to free text, they just have a different default position and font).
The numeric functions above will usually result in a display with more significant digits than desirable. To format the result with less accuracy, use the FormatNumber() function. For example:
{FormatNumber(RMS1(cv(%curve%)), 5)}
Will display the result to 5 digits.
| ◄ Graph Zooming and Scrolling | Exporting/Importing Graphs and Data ▶ |