4.4 Add Scalar Measurements to Output Curves
This section of the tutorial describes how to add measurements to curves in the waveform viewer.
In this topic:
Key Concepts
This topic addresses the following key concepts:
- SIMetrix/SIMPLIS has a powerful set of built-in measurements which can be applied to any curve.
- The Measure menu in the waveform viewer gives you access to the curve measurements.
What You Will Learn
In this topic, you will learn the following:
- How to add measurements to a curve.
- How to access all of the measurements and functions available in the waveform viewer.
4.4.1 Add Measurements to the Curve
To add a measurement to the graph, follow these steps:
- From the schematic editor, click F9 to run a simulation.
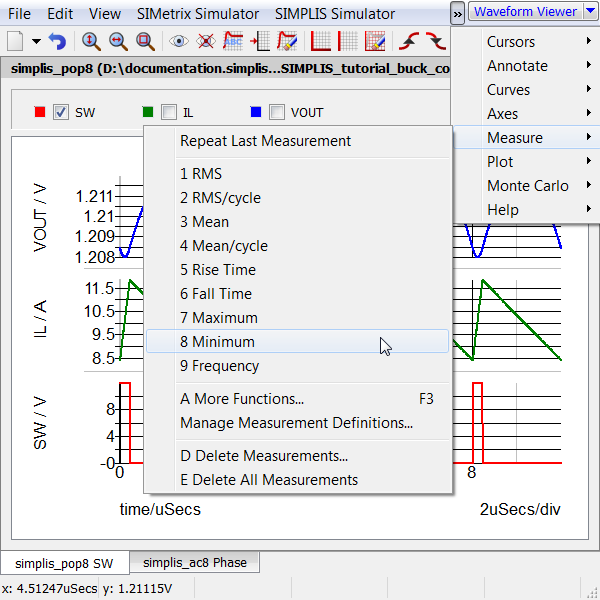
- In the upper left corner just below the waveform viewer tool bar, check SW waveform.
- From the waveform viewer menu, select Measure > Minimum.
 Result: The minimum value of the SW voltage waveform now appears on the graph legend under where you checked SW.Note: To see the complete label, you may have to adjust the splitter bar between the label and the tabs for the graphs.
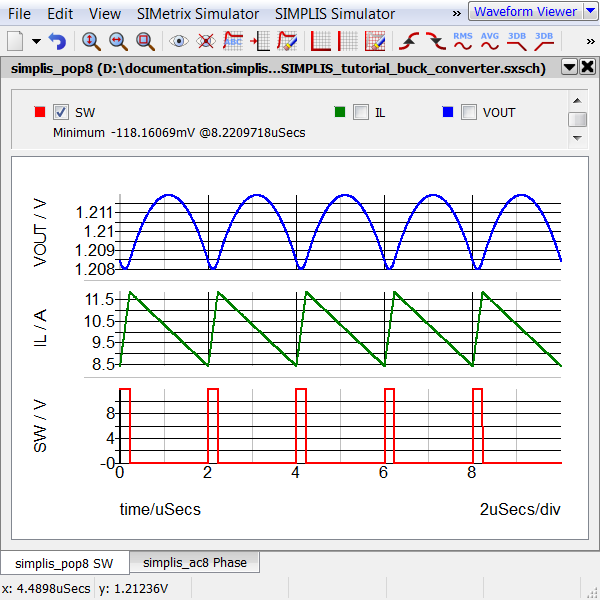
4.4.2 View All Available Measurements
To see a full list of available measurements, do one of the following:
- From the menu bar in the waveform viewer, click Measure and then select A
More Functions....
or
Press the keyboard shortcut F3.Result: The Define Measurement dialog appears and allows you to select more complex measurements as well as to add custom measurements to the graph data window.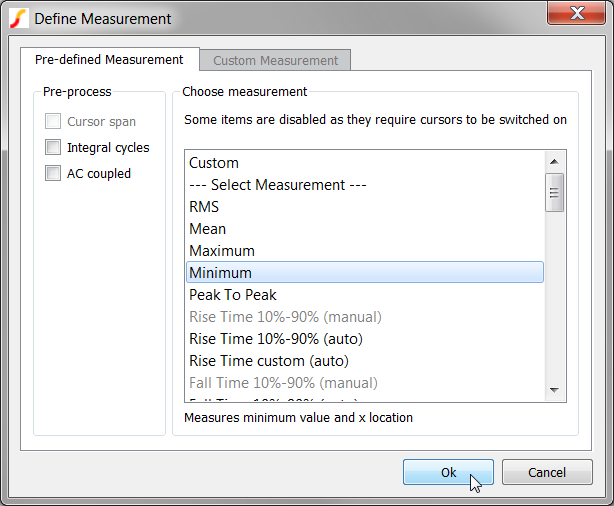
For more information on the Define Measurement dialog, see Chapter 9 of the SIMetrix User Manual.