|
Name
|
Type
|
Description
|
User
|
|
700Extensions
|
Boolean |
Schematic symbols for the 700 series semi-custom arrays are enabled if this is set. |
|
|
ActionOnMissingModel
|
string |
Default=AutoAssociate
Action to be performed when attempting to place a model from the library, but that model has not been associated. If set to AutoAssociate, will attempt to auto-associate by simulating the model
|
|
|
AllowTempDataDrives
|
String |
List of drives separated by commas which are allowed to be used for simulation data without triggering a warning message. Drive should be specified with ':' suffix - e.g Y:. A warning message will be issued for any drive that is reported as connected through a network if used for simulation data storage. Only use this setting to override drives that are reported as network drives but in fact are connected locally. |
|
|
AlphaBlendRatio
|
Numeric |
Default=75
Value of 0 to 100 controls the opacity of plotted curves. 0 is totally transparent (and therefore invisible). 100 is fully opaque
|
No |
|
AnnoMinSuffix
|
Numeric |
Default = 1
Minimum suffix used for automatic generation of schematic part references
|
|
|
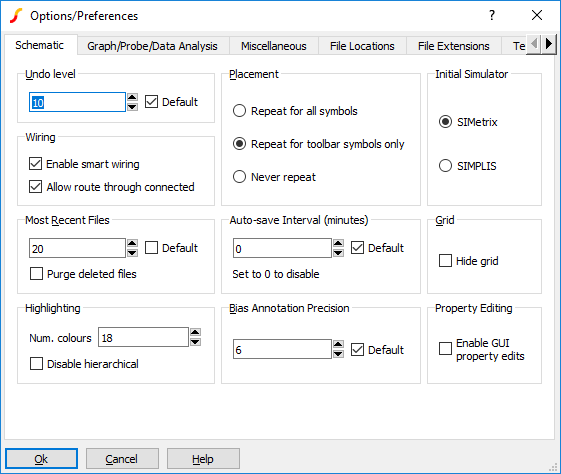
AutoStartWire
|
Boolean |
Default=False
Only effective if AutoWireEnabled is False.
Selects mode whereby a wire is started when the cursor is brought close to a pin or wire termination. This mode is on automatically when AutoWireEnabled is True
|
Options
dialog
|
|
AutoWireEnabled
|
Boolean |
Default=True
Smart wiring is on if this is True
|
Options
dialog
|
|
AWAllowRouteThruConnected
|
Boolean |
Default=True
Controls whether the smart wire algorithm is allowed to route wires through existing wires that connect to the destination or target
|
Options
dialog
|
|
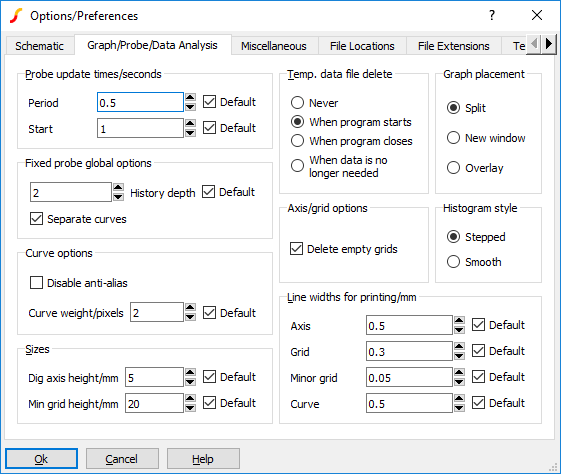
AxisPrintWidth
|
Numeric |
Default = 0.5
Width of printed axis in mm. See also CurvePrintWidth and GridPrintWidth
|
Options
dialog
|
|
AutoSaveInterval
|
Numeric |
Default=0 meaning disabled. Interval in minutes for which the session is automatically saved in order to recover from an unexpected program exit |
Options dialog |
|
BiasAnnoPrecision
|
Numeric |
Default=6
Precision of values displayed for schematic DC bias annotation
|
Options
dialog
|
|
BiScriptDir
|
Text |
This is the first location that SIMetrix searches for scripts. See File Locations section of Options
dialog above for more info.
|
Options
dialog
|
|
BuildAssociations
|
Text |
Default=ask
See Auto Configuration Options
|
|
|
BuildModelLibs
|
Text |
Default=ifempty
See Auto Configuration Options
|
|
|
BuildPreferenceSettings
|
Text |
Default=askmigrate
See Auto Configuration Options
|
|
|
BuildSymbolLibs
|
Text |
Default=ifempty
See Auto Configuration Options
|
|
|
CachePathSymbols unsupported
|
Boolean |
Default=false
If true, SIMetrix will cache symbolic paths
|
|
|
ComponentExtension
|
Text |
Default=sxcmp
File extension for schematic component files
|
Options
dialog
|
|
CursorDisplay
|
Text |
Default = Graph. Controls initial graph cursor readout display.
|
Graph
|
Display on graph only |
|
StatusBar
|
Display on status bar only |
|
Both
|
Display on both graph and status bar
|
|
Options
dialog
|
|
CurveNoAntiAlias
|
Boolean |
Default = false. If false, curves are plotted using anti-aliassing. This improves the visible quality of the curve. However, anti-alias processing for curves with more than one pixel width is slow. As a consequence curves of medium or high complexity are forced to single pixel if anti-aliasing is enabled. Setting this option to true will degrade plotted quality but will allow curves of 2 or more pixels to be plotted for all levels of complexity |
No |
|
CurvePrintWidth
|
Numeric |
Default = 0.5mm
Width of printed graph curves in mm. See also GridPrintWidth.
|
Options
dialog
|
|
CurveWeight
|
Numeric |
Default = 1
Sets the line width in pixels of graph curves. Note that although widths greater than 1 are clearer they normally take considerably longer to draw. This does however depend on the type of adapter card and display driver you are using.
|
Options
dialog
|
|
DataExtension
|
Text |
Default=sxdat;dat
Default file extension for data files
|
Options
dialog
|
|
DataGroupDelete
|
Text |
Default = OnStart
Determines when temporary simulation data is deleted. Possible values, Never, OnStart, OnClose and OnDelete. See Graph/Probe/Data Analysis for details.
|
Options
dialog
|
|
DataHistoryDepth
|
Numeric |
Default=4. Controls the number of previous results stored in each curve created by a fixed probe |
No |
|
DefaultLib
|
Text |
Default=%SHAREPATH%/SymbolLibs/default.sxslb
Name and location of default symbol library
|
|
|
DefaultPersistence
|
|
Default=0
Sets the number of curves that are kept for graph fixed probes. '0' means that all curves are kept. '1' means that only 1 is kept at a time.
|
Options
dialog
|
|
DevConfigFile
|
Text |
Default=%SHAREPATH%/DeviceConfig.cfg
Name and location of device configuration file. See Simulator Reference Manual for details
|
|
|
DigAxisHeight
|
Numeric |
Default = 8.0mm
Height of digital axis in mm. (Screens are typically 75pixels/inch)
|
Options
dialog
|
|
DisableCurveDataCompression
|
bool |
Default=FALSE Set to TRUE to disable curve point compression. This generally speeds up graph drawing but can introduce minor artefacts |
No |
|
DisplaySimProgressMessage
|
Boolean |
Default=False
If true, a message will be displayed in the command shell indicating the start and end of a simulation
|
|
|
EchoOn
|
Boolean |
When set, all commands are echoed to the command shell message window. This is used primarily for script debugging. |
Options
dialog
|
|
EnableFileChangeWatcher
|
bool |
Default=TRUE The GUI monitors changes to files and prompts the user to reload when changes are detected. Set this to FALSE to disable |
No |
|
EnableFileChangeWatcher
FileView
|
bool |
Default=TRUE The file viewer monitors changes to files and updates if changes are detected. Set to FALSE to disable this behaviour |
No |
|
EnableLWEditMenu
|
bool |
Default=FALSE Enables the schematic popup menu Edit MOS Length/Width... which edits the length, width and multiplier (M) for MOSFETs used in IC design
|
|
|
ExportRawFormat
|
Text |
Default = SPICE3
Possible values, SPICE3, SPECTRE and OTHER. Controls format of raw output. See Exporting SPICE3 Raw Files
|
No |
|
ForceGlobalHash
|
Boolean |
Default=false
In the simulator, any node name found in a subcircuit that starts with a '#' accesses a top level node of the same name but without the '#'. E.g. #VCC in a subcircuit connects to VCC at the top level.
If this option is set, the '#' is not stripped, so #VCC in a subcircuit connects to #VCC at the top level.
|
|
|
GraphExtension
|
Text |
Default=sxgph
File extension used for graph files
|
Options
dialog
|
|
GraphLegendMaximum
HeightProportion
|
real |
Default=0.25 Maximum height of the graph legend window as a proportion of the graph window height |
|
|
GraphPlacement
|
string |
Default=split.
Selects how new graph windows are created. Has one of three values
|
Split
|
Splits current layout and places graph on the right side |
|
NewWindow
|
Creates a new main window for graphs if one does not already exist |
|
Overlay
|
Overlays graph windows over the top of existing windows |
|
Options
dialog
|
|
GridPrintWidth
|
Numeric |
Default = 0.3mm
Width of printed graph grid lines in mm. See also CurvePrintWidth
|
Options
dialog
|
|
GroupPersistence
|
Numeric |
Default = 3
Sets the number of groups that are kept before being deleted. See Plotting the Results from a Previous Simulation
|
No |
|
GuiEditPropertyEnabled
|
Boolean |
Default=false
If set, allows visible properties in the schematic to be edited using GUI actions.
|
Options
dialog
|
|
HideSchematicGrid
|
Boolean |
If set, the schematic grid will be suppressed |
Options
dialog
|
|
HistoAdvancedStats
|
bool |
Default=FALSE Display advanced statistics in histogram plots |
Performance analysis dialog |
|
HighlightIncrement
|
Numeric |
Default = 1
Highlighted graph curves are thicker than normal curves by the amount specified by this option
|
No |
|
HistoCurveStyle
|
Text |
Default=stepped
Sets histogram curve style
|
Options
dialog
|
|
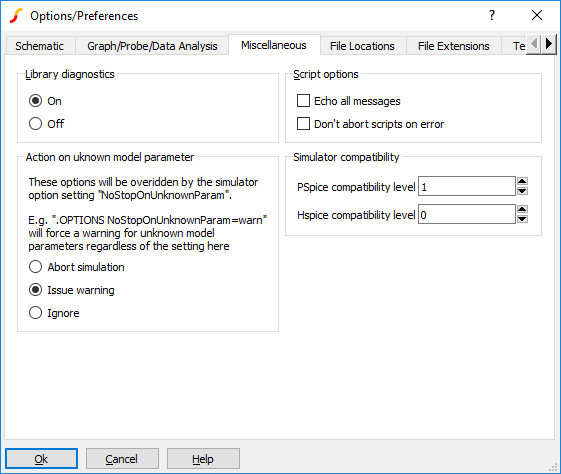
HSpiceCompatibility
|
Numeric |
Default=0
Value of 0 or 1. Global default value for simulator option (.OPTIONS) of the same name. See Options Dialog Miscellaneous Options
|
Options dialog |
|
InitSchematicSimulator
|
Text |
Default=SIMetrix
Simulator mode for new schematic. If set to SIMPLIS, all schematics will start in SIMPLIS mode. Otherwise they start in SIMetrix mode
|
Options
dialog
|
|
InterpOrder
|
Numeric |
Default=2
Sets interpolation order for the FFT calculation used for distortion measurements
|
|
|
InterpPts
|
Numeric |
Default=1024
Sets number of interpolated points for the FFT calculation used for distortion measurements
|
|
|
InvertCursors
|
Boolean |
Default=false
If true, schematic and graph mouse cursors are modified to be suitable for use on a black background
|
|
|
LibraryDiagnostics
|
Text |
Default = Full
Possible values, Partial, None and Full. Affects progress information displayed during model library searching.
|
Options
dialog
|
|
LicenseDisableFast
Checkout
|
Boolean |
Default=false
Affects network licenses only. If set, the license checkout process may take longer delaying the time it takes SIMetrix to start.
|
|
|
LogicDefExtension
|
Text |
Default=ldf
File extension used for logic definition files
|
Options
dialog
|
|
MaxHighlightColours
|
Numeric |
Default=4
Maximum number of different colours used for schematic highlighting
|
|
|
MeasurePrecision
|
Numeric |
Default=8
Precision of measurements in the graph window
|
|
|
MaxVectorBufferSize
|
Numeric |
Default=32768
See the Simulator Reference Manual
for a full explanation
|
|
|
MinGridHeight
|
Numeric |
Minimum allowed height of graph grid |
Options
dialog
|
|
MinGridWidth
|
Numeric |
Minimum allowed width of graph grid |
No |
|
MinorGridPrintWidth
|
Numeric |
Default=0.05
Print width in mm of graph's minor grid
|
Options
dialog
|
|
ModelExtension
|
Text |
Default=lb;lib;mod;cir
File extensions used for model files
|
Options
dialog
|
|
MRUSize
|
Numeric |
Default = 4
Number of items in File | Reopen menu.
|
Options
dialog
|
|
NewModelLifetime
|
Numeric |
Default=30
Number of days that user installed models remain displayed in the '* Recently Added Models *' model library browser category
|
|
|
NoEditPinNamesWarning
unsupported
|
Boolean |
Default=false
If true, the warning given when using the Edit Pin Names button in the associate models dialog box is inhibited
|
|
|
NoHierarchicalHighlighting
|
Boolean |
Default=false
If set hierarchical schematic highlighting is disabled. That is, if you highlight some part of a hierarchical schematic, only that schematic will be highlighted with no propagation to parent or child schematic
|
|
|
NoKeys
|
Boolean |
If on, the default key definitions will be disabled. Note this will not take affect until the next session of SIMetrix.
|
Options
dialog
|
|
NoMenu
|
Boolean |
If on, the default menu definitions will be disabled and no menu bar will appear. This will not take affect until the next session of SIMetrix. |
Options
dialog
|
|
NonHighlightAlpha
|
Numeric |
Default=25
When highlighting individual divisions in a grouped curve, the divisions that are not highlighted are displayed with a lower alpha value than the highlighted divisions. This is to make the highlighted divisions stand out more clearly. This option defines the akpha value for the divisions that are not highlighted
|
No |
|
NoStopOnError
|
Boolean |
If disabled, scripts and multi-command lines (i.e. several commands on the same line separated by ';') are aborted if any individual command reports an error. |
Options
dialog
|
|
NoStopOnUnknownParam
|
Text |
Specifies action to be taken in the event of an unknown parameter being encountered in a .MODEL statement. Choices are:
TRUE: No action taken, simulation continues normally
FALSE: An error will be raised and the simulation will abort
WARN: A warning will be displayed but the simulation will continue
This will be overridden by a .OPTIONS setting of the same name. Refer to Simulator Reference Manual/Command Reference/.OPTIONS for details
|
Options
dialog
|
|
OmitAsciiRevision unsupported
|
Boolean |
Default=false
If true, the revision value is not written to ASCII schematic files. For backward compatibility.
|
No |
|
PartSelShowSimplisModels
|
Boolean |
Default=False
If true, model library parts will show directly in the part selector in SIMPLIS mode
|
No |
|
PartSelShowSimetrixModels
|
Boolean |
Default=True
If true, model library parts will show directly in the part selector in SIMetrix mode
|
No |
|
PassUnresTemplate unsupported
|
Boolean |
Default=false
If true, unresolved template values in netlists will be passed literally. Default behaviour is no output
|
No |
|
Precision
|
Numeric |
Default = 10
Precision of numeric values displayed using Show command.
|
No |
|
PrintOptions
|
Text |
Options set in print dialog |
Print
dialog
|
|
PrintWireWidth
|
Numeric |
Default=5
Width in pixels of schematic wires when printed
|
No |
|
ProbeFlushOnUpdate
|
Boolean |
Default=false
It is not usual to need to set this option. Simulation data is buffered for performance reasons but this buffering can interfere with the incremental updates needed for fixed probes. Usually SIMetrix deals with this problem automatically but this is not guaranteed to work in all cases. In such situations, fixed probes or .GRAPH statements may not incrementally update correctly. Setting this option may rectify this.
|
|
|
ProbeStartDelay
|
Numeric |
Default = 1
Delay after start of simulation run before fixed probe graphs are first opened.
|
Options
dialog
|
|
ProbeUpdatePeriod
|
Numeric |
Default = 0.5 seconds
Update period for fixed probe graphs
|
Options
dialog
|
|
PSpiceCompatibility
|
Numeric |
Default=1
Value of 0, 1 or 2. Global default value for simulator option (.OPTIONS) of the same name. See Options Dialog Miscellaneous Options
|
Options dialog |
|
RebuildConfig
|
Boolean |
Default=true
See Auto Configuration Options
|
No |
|
RenderNumThreads
|
Numeric |
Default=number of installed processor cores
Number of threads used to draw multi-division curves
|
No |
|
RepeatPlace
|
Text |
Default = Toolbar
Controls when schematic placement is repeated. Possible values, Always, Toolbar (toolbar symbols only) and Never.
|
Options
dialog
|
|
SchematicReadOnly
|
Boolean |
Default=false
If set all schematics are opened in read only mode
|
No |
|
SchemDoubleClickScript
|
Text |
Default=on_schem_double_click /ne
Script that is called when a double click action is detected in the schematic. Only active if SchematicEditMode= NoSnap
|
|
|
ScriptDir
|
Text |
Default=%SXDOCSPATH%/Scripts
%SXDOCSPATH% is "My Documents/SIMetrix"
Directory used to search for scripts and symbol files if not found in the current directory. Changes to this option do not take effect until next session.
|
Options
dialog
|
|
ScriptExtension
|
Text |
Default=sxscr
File extension used for scripts
|
Options
dialog
|
|
ShellCommandProcessor
|
Text |
String used to launch command processor when /command supplied with "Shell" script command. See Shell command in the Script Reference manual for more details |
|
|
SHOWWELCOMEPAGE
|
Boolean |
Default=true. If set a welcome page will be displayed on first start |
Welcome page |
|
SimDataGroupDelete
|
Text |
Default=Never
Same as DataGroupDelete when simulator is run independently. I.e. not called from the front end
|
No |
|
SIMPLISPath
|
Text |
Default=%EXEPATH%/simplis.exe
Path of SIMPLIS binary
|
No |
|
SnapshotExtension
|
Text |
Default=sxsnp
File extension used for snapshot files
|
|
|
StartUpDir
|
Text |
Current directory set at start of session. |
Options
dialog
|
|
StartUpFile
|
Text |
Default = Startup.SXSCR
Script that is automatically run at start of each session.
|
Options
dialog
|
|
StatusUpdatePeriod
|
Numeric |
Default = 0.2 seconds
Minimum delay in seconds between updates of simulator status window during run.
|
No |
|
SymbolExtension
|
Text |
Default=sxslb;slb
File extension used for symbol files
|
|
|
SymbolsDir
|
Text |
Default=%SHAREPATH%/SymbolLibs
Path of directory where system symbol libraries are located.
|
Option dialog |
|
SystemStyle
|
Text |
Default=LightStyle.qss. Sets the style sheet that defines the user interface style. May be set to DarkStyle.qss or custom generated style sheet placed in support\ ui |
|
|
TempDataDir
|
Text |
Default = %TEMPPATH%/
SIMetrixTempData
See Default Configuration Location for definition of %TEMPPATH%
Directory where temporary simulation data files are placed.
|
Options
dialog
|
|
TextExtension
|
Text |
File extension used for text files |
|
|
TotalVectorBufferSize
|
Numeric |
See the Simulator Reference Manual
for a full explanation
|
|
|
TitleBlockDefaultAuthor
|
Text |
The default authour for title blocks |
Title block interface |
|
TitleBlockDefaultCompany
|
Text |
The default company name for title blocks |
Title block interface |
|
TitleBlockDefaultLogoPath
|
Text |
The path of the default logo for title blocks. Should be a bitmap file such as .jpg, .png, .bmp or .gif |
Title block interface |
|
ToolBarIconSize
|
Numeric |
Default = 20. Size of toolbar icons in pixels. Takes effect on restart |
No |
|
TranscriptErrors
|
Boolean |
Default=false
If true, incorrectly typed commands will be entered in the history box. (The drop down list in the command line that shows previously entered commands)
|
|
|
UndoBufferSize
|
Numeric |
Default = 10
Number of levels of schematic undo. See Creating a Schematic
|
Options
dialog
|
|
UpdateClosedSchematics
|
Boolean |
Allows SIMetrix to write to closed schematic if required. See Closed Schematics
|
|
|
UpdateCurvesNoDeleteOld
|
Boolean |
Default=false
If true, old curves are not deleted when using the Update Curves feature.
|
Plot | Update Curve Settings |
|
UpdateCurvesNoFixSelected
|
Boolean |
Default=false
If true update includes selected curves when using the Update Curves feature
|
Plot | Update Curve Settings |
|
UseLocalHelp
|
Boolean |
If set, the help system will use locally stored content. Note that the local content must be installed for this to work. Menu will automatically set this option and install local content if needed.
|
|
|
UserScriptDir
|
Text |
Alternative location for user scripts. See Script Reference Manual/Script Language/Executing Scripts for more information
|
No |
|
UserSymbolsDir
|
Text |
Path of directory where the user's symbol libraries are stored. |
Options
dialog
|
|
UserSystemSymbolDir
|
Text |
Default=%sxappdatapath%/SysSymbols
Location of symbol libraries containing edits to system symbols
|
No |
|
VideoBufferTotalSize
|
Numeric |
Default=100000000 (100MBytes). The total memory allowed to be used for video buffers. The bitmap image of each schematic and graph window is buffered in memory. This allows for fast redraw when tabs are switched or when a window is exposed. Without this buffering, the windows need to be redrawn which in the case of graphs can be time consuming. The buffers consume memory and this setting specifies how much memory may be allowed to be used for the buffers (that is all buffers together, not each one). If all the buffers needed exceed this memory allowance, some windows will be released meaning that a redraw will be needed when that window needs to be displayed. |
No |
|
VlDataPath
|
Text |
Default=%SXAPPDATAPATH%/veriloghdl
Location of Verilog-HDL files. Currently only the cache data is stored here
|
|
|
VlModuleCacheSize
|
Numeric |
Default=1000
Maximum number of cache entries for Verilog-HDL module info cache
|
|
|
WarnSubControls
|
Boolean |
Default=false
If true, a warning will be issued if unexpected simulator commands are found in subcircuits.
|
No |