Graph Layout
Graphs may have additional Y axes to accommodate plotting results with incompatible scales. This occurs particularly for plotting dB and phase against each other and also for voltage and current. The additional Y axes may either be superimposed or stacked. In the user interface and the remainder of this documentation these are referred to respectively as Axes and Grids. These are illustrated below.
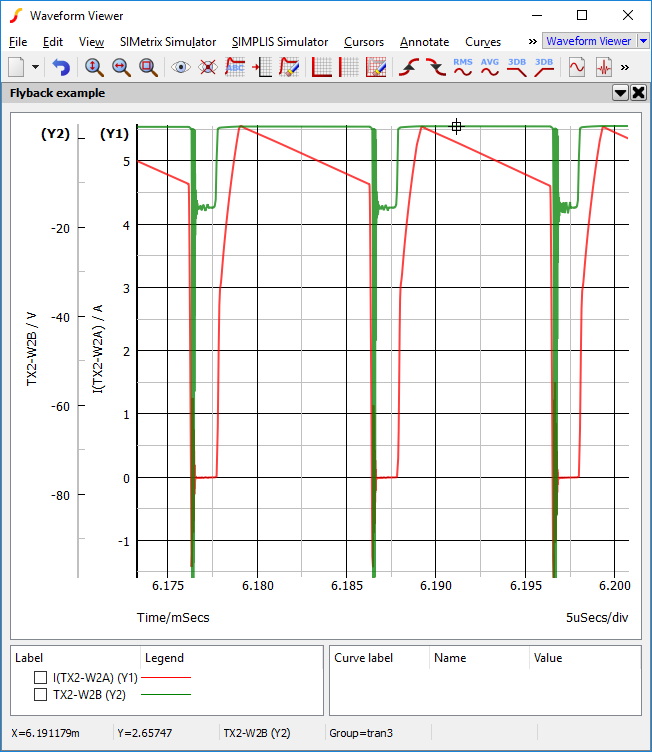 |
Current and Voltage plotted on separate Axes |
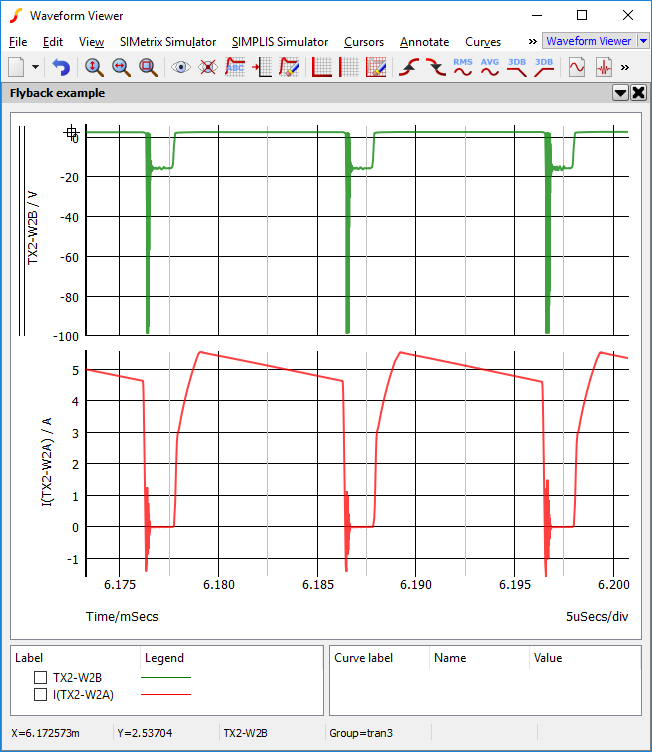 |
Current and Voltage plotted on separate Grids |
In this topic:
AutoAxis Feature
When you plot a new curve on an existing graph, SIMetrix will select - or if necessary create - a compatible axis for that curve. The decision is made on the basis of the curve's Units i.e voltage, current etc. The rules it follows are:
- If the currently selected axis or grid (shown by black axis line) has the same units as curve to be plotted or if it has undefined units (designated by a '?' on label), that axis will be used.
- If any other axis on the currently selected grid has compatible units (i.e same as curve or undefined) that axis will be used.
- If no axes exist with compatible units on the selected grid, a new y-axis will be created to accommodate the curve.
Curve /AutoAxis L3#P
Manually Creating Axes and Grids
Two toolbar buttons Create new grid and Create new axis allow manual creation of new axes and grids. These will be initially empty. Subsequent random probe operations will use the new axis or grid unconditionally as long as it remains selected (see below).
Selecting Axes
Some operations are performed on the selected axis or grid. The selected y-axis will be displayed with its vertical axis line a deep black while the remaining axes will be light grey. Selected grids are displayed with a double vertical line at the far left. Newly created axes and grids are always selected. To select an axis, click the left mouse button immediately to the left of the vertical axis line.
Stacking Curves to Multiple Grids
The menu will place each curve on its own grid.
The menu will place each selected curve on its own grid.
Moving Curves to Different Axis or Grid
You can freely move curves around from one axis or grid to another. Proceed as follows:
- Select the curve or curves you wish to move by checking its checkbox next to the coloured legend which designates the curve.
- Select the axis you wish to move it to. (See above)
- Press the Move selected curves to new axis button. The curves will be re-drawn on the new axis. Any axes that become empty as a result of this operation will be deleted unless it is the Main axis. See Deleting Axes.
Detached X-Axes
Grids may have attached or detached x-axes. Attached x-axes are shared with other x-axes in the same graph sheet. That is they zoom in sync - when the limits are changed on one grid, the other grids' x-axes are also changed.
Detached x-axes are independent and have their own axis limits. Detached axes may be created in a number of ways:
- In the Add Curve dialog box (menu ) select the use detached new grid option in the Axis options group. This will plot the curve on a new grid with a detached x-axis.
- Any existing grid can be converted to detached status using menu .
- Holding down the control key while zooming will create a new grid with a detached x-axis. This is a convenient way to create a new view of some detail of a curve without losing the original wide view
- Detached axes will automatically be created in situations where the existing shared axis is not compatible with physical type of the new curve being plotted. For example, if you plot an AC analysis result in a graph sheet containing only time axes, a detached axis will be created to plot it.
Deleting Axes
To delete an axis, select it then press Erase axis button or menu .
Editing Axes
You can edit axis scales, label and units by selecting the graph popup menu . This brings up the following dialog box:
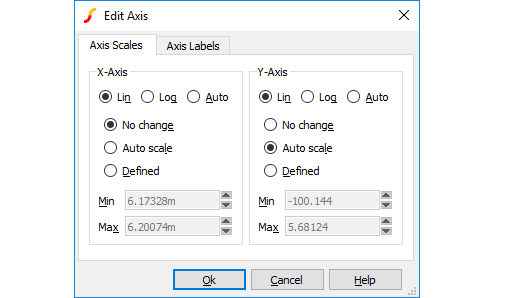 The function of the Axis scales sheet and axis labels sheet is similar to the sheets of the same name in the define curve dialog box. See Plotting an Arbitrary Expression for details.
Reordering Grids and Digital Axes
You can change the vertical order of the analog grids and digital axes. To change the analog grid order:
- Select
- You will be presented with a list of currently displayed grids identified by their y-axis title. Use the up and down arrow buttons to arrange them in the order required then click Ok
- Select menu
- Rearrange entries in list as described above for analog grids.
| ◄ Plot Journals and Updating Curves | Curve Operations ▶ |