2.4.6 Using Plot Journals
To download the examples for Module 2, click Module_2_Examples.zip
In this topic:
What You Will Learn
- How to recreate the curves on a graph using Plot Journals.
- How to run plot journals both with the GUI and automatically after the simulation completes.
Getting Started
Exercise #1: Generate a Frequency Spectrum Plot
- Open the schematic 2.6_SelfOscillatingConverter_POP_dot_graph.sxsch.
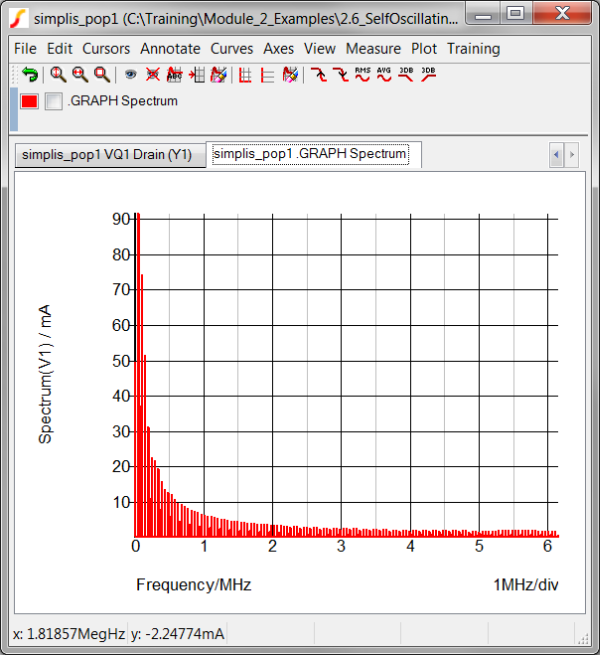
- Run the simulation. Result: The POP simulation executes and the frequency spectrum of the current in V1 is automatically plotted on the waveform viewer:
Discussion
There are often times you would like to load data from a previous simulation and recreate the curves which were generated during that run. As discussed in the 2.3 Managing Simulation Data topic, the data group only contains the raw data from the simulation, and doesn't have any information on the curves which were plotted. Therefore another way to re-create the curves from the vectors contained in the data group is needed. Plot journals are one way to accomplish this.
Plot Journals
Plot journals are nothing more than SIMetrix/SIMPLIS scripts containing the script commands to create the curves on a particular graph tab. The program will create the plot journal script for you when you execute the graph menu Plot ▶ Create Plot Journal... In the next exercise you will create a plot journal.
Exercise #2: Create a Plot Journal
To create a plot journal, follow these steps:
- Make certain the graph tab which you wish to create a plot journal for is the currently selected graph tab. In this example, you will generate a plot journal for the spectrum curve.
- In the waveform viewer, select the graph tab containing the spectrum curve.
- From the graph menu, select Plot ▶ Create
Plot Journal...
Result: A file browser opens to the directory containing the schematic, prompting you to select a file name for the plot journal.
- Type the file name spectrum in the File name field as shown below:
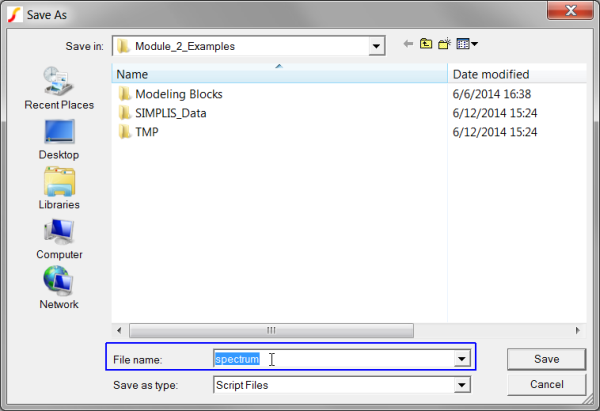
- Click Save. Result: SIMetrix/SIMPLIS composes a script file which, when run, will re-create the current graph tab. The file is saved in the same directory as the schematic and is named spectrum.sxscr.
Exercise #3: Running a Plot Journal
To run a Plot Journal, execute the graph menu: Plot ▶ Run Plot Journal... In this exercise you will run the plot journal you created in the first exercise and compare the graph tab created when you ran the simulation to the one created by the plot journal.
- From the graph menu, select Plot ▶ Run Plot
Journal...
Result: A file selection dialog is opened for you to select the script to run. As the program saves the most recently created plot journal to the schematic file, the file selection dialog is populated with this file
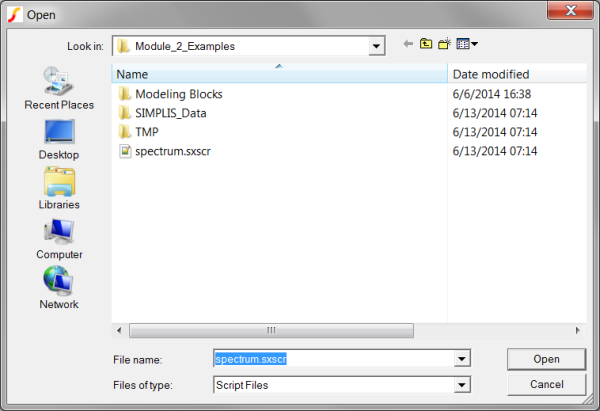 name.
name. - Click Ok. Result: The plot journal script, spectrum.sxscr, runs, recreating the spectrum graph tab.
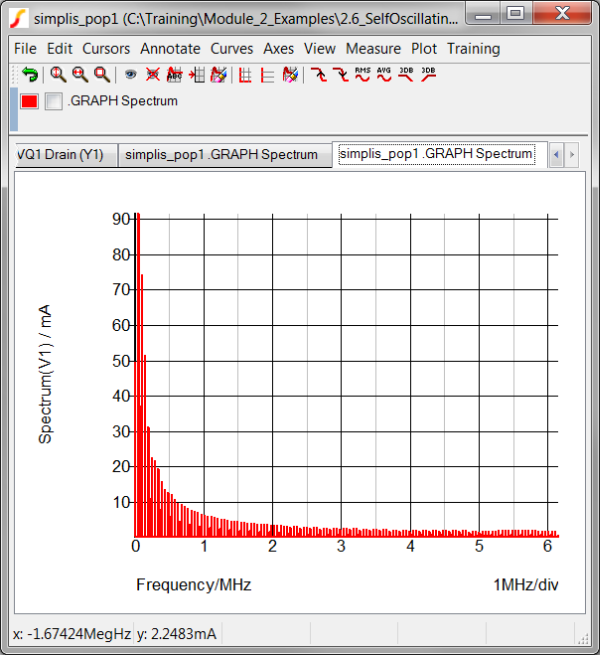
At this point, the waveform viewer has two identical graph tabs, each with a spectrum curve. If you alternately select each spectrum graph tab, you will easily see the two graphs are identical.
Exercise #4: Automatically Run a Plot Journal After the Simulation Completes
SIMetrix/SIMPLIS has the ability to automatically run a script file after the simulation executes. The .POST_PROCESS command tells the program to execute a script by name, and can be added to the F11 window. In this exercise, you will add a .POST_PROCESS command to the command (F11) window. This command will run your plot journal, exactly as if you used the Plot ▶ Run Plot Journal... menu item. To automatically run the plot journal,
- On the schematic window, press the F11 key to open the command window.
- Add the following text to the end of the F11 Window:
.POST_PROCESS spectrum.sxscr
- Close the waveform viewer.
- Run the simulation. Result: The waveform viewer opens with both spectrum tabs: One tab was created with the .GRAPH command from section 2.4.5 The .GRAPH Statement, and another tab was created from the plot journal script.
A couple of points about using the .POST_PROCESS control:
- You can add multiple .POST_PROCESS control statements to the F11 window to call multiple scripts. Each .POST_PROCESS command will execute a single script.
- The .POST_PROCESS commands are executed after each simulation completes; that is, if you ran a POP/AC analysis, the .POST_PROCESS script will run after each analysis completes. This presents a problem in that the plot journal script is intended to plot data from the current group, in this case the POP group. If the Plot journal is run on the AC data group, the Spectrum function will fail, producing a blank graph tab.
- The .POST_PROCESS control assumes the script is located in the same directory as the schematic. You can add relative paths from the schematic or full paths as needed.
- If the path and script name contains spaces the path/name must be enclosed in double quotes.
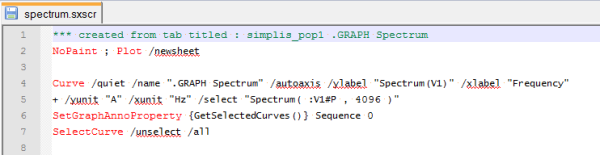
Viewing a Plot Journal
As mentioned in the Discussion section, a plot journal is a SIMetrix/SIMPLIS script file created when you run the menu item: Plot ▶ Create Plot Journal... You can view the plot journal in any text editor including Notepad++. Using Notepad++ will show the syntax highlighting of the comments and commands in the script as shown below:
Conclusions and Key Points to Remember
- The Plot Journal method is a quick way to re-plot data from saved data groups.
- The Plot Journal plots curves using data from the current data group.
- You can automatically run a plot journal script using the .POST_PROCESS command.