The Full Power Assist DVM control symbol stores the same information
as the Basic DVM control symbol but
also includes specifications for the sources and loads, as well as performance
specifications. The DVM control symbol dialog consists of two areas:
- The page selection box on the left where you select the page that
you want to edit
- The entry fields on the right side of the dialog where you enter
specifications
Adding a Full Power
Assist DVM Symbol to a Schematic
To add a Full Power Assist DVM Control
Symbol to a working schematic, follow these steps:
- From the parts selector, choose DVM ▶ Control Symbols ▶ Full Power Assist DVM
Control Symbol.
Result: The SIMPLIS DVM Power
Assist Control Symbol appears.
- Place the symbol at the top of the schematic.
- Double click the symbol.
Result: The SIMPLIS DVM
Control Panel dialog opens for you to enter the information that is described in
the following sections.
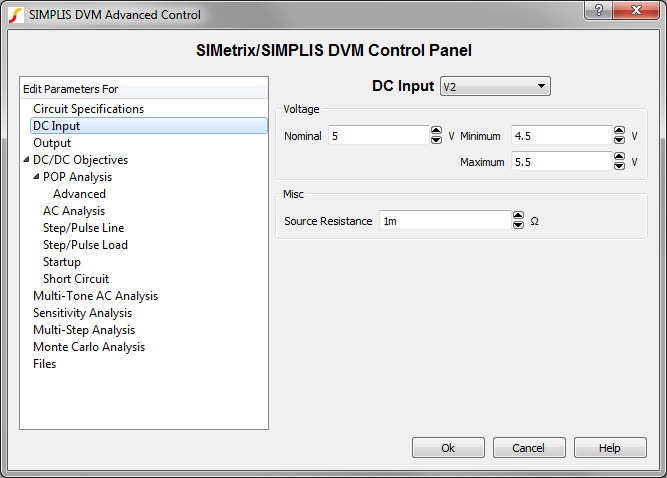
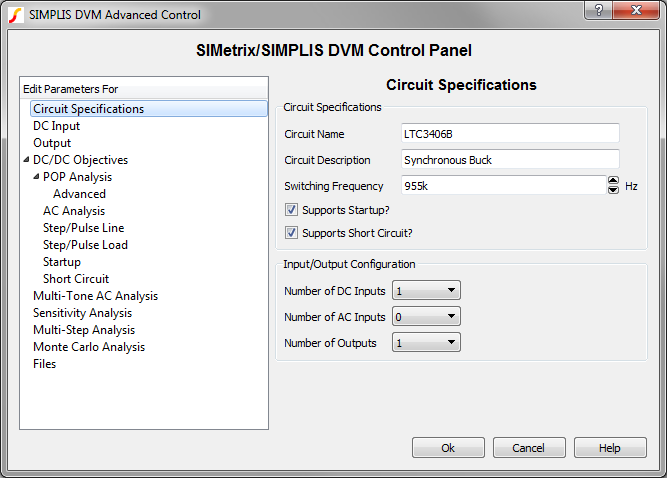
Circuit Specifications
The Circuit Specifications page allows you to
define circuit descriptions and specifications that DVM uses when measuring and checking
scalar values in the simulation. On this dialog, you also specify the number of DC inputs,
AC inputs, and outputs. Additional pages appear for each input and for each output as shown
in the page selection panel below. This dialog is configured for one DC input and one output
load.
| Label |
Parameter Description |
| Circuit Name |
Name of the circuit as it will appear
in the DVM report; for display purposes only. |
| Circuit Description |
Description of the circuit under test
which appears in the DVM Control symbol; for display purposes only. |
| Switching Frequency |
Nominal switching frequency used to
calculate simulation timing for DC/DC test objectives |
| Supports Startup? |
If checked, the Startup() test
objectives startup tests will be performed; if not checked, the Startup() test
objectives will be skipped. |
| Supports Short Circuit? |
If checked, the ShortCkt() test
objectives will be performed; if not checked, theShortCkt() test objectives will be
skipped. |
| Number of DC Inputs |
The numbers that you select in these
three fields dynamically change the page selection list to accommodate the number of
AC and DC inputs and the outputs that will then be available for you to
configure. |
| Number of AC Inputs |
| Number of Outputs |
▲ back to top
▲ back to top
▲ back to top
Output Page
An Output page is added for each load
that was defined on the Circuit
Specifications page. The Output page allows you to define specifications
for each output source in your circuit. The Output drop-down menu at the top allows
you to select the reference designator from a list of available DVM Loads. For a list
of available output load subcircuits, see Output Load
Subcircuits.
Note: DVM supports up to five outputs.
To increase or decrease the number of
managed outputs, change that number on the Circuit Specifications page before you edit the DVM control symbol to add
a new load.
To place a new load
on the schematic and then manage the output, follow these steps:
- From the Output drop-down menu, select Place New Load, and then click
Ok.
Result: A dialog opens, prompting you
to place the new source.
- Click Ok and then click to place the load on the schematic.
Note: If you
click Cancel at any point when you are placing sources and loads, all
previous actions will be cancelled and you must re-edit the control symbol and
place all the sources and loads again; or you can manually place the sources
and loads before you edit the control symbol and then select them from the
drop-down menus.
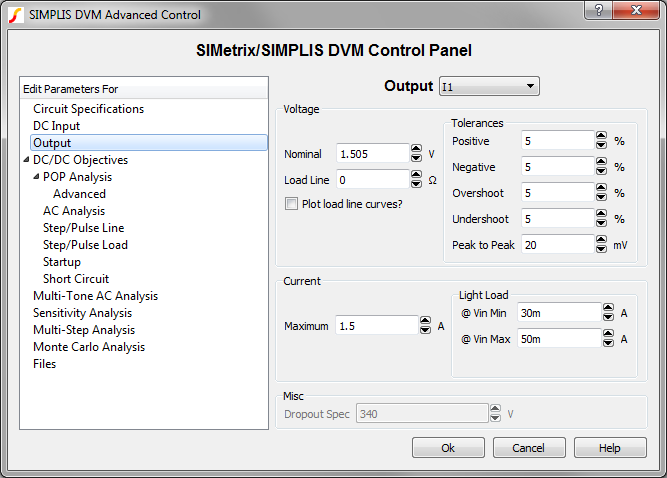
| Voltage: Specifications for
output voltage |
| Nominal |
Nominal DC output
voltage |
| Load Line |
The nominal output
impedance of the output. This is used in conjunction with the nominal
voltage to determine if the output voltage is within the setpoint range
and overshoot/undershoot specifications. The formula for the output
voltage setpoint, overshoot, and undershoot are shown below:
\[ \text{Positive Setpoint Limit} =
\text{Nominal} * 1 + \frac{\text{Positive}}{100} - \text{Load Line} *
\text{ILoad} \] \[ \text{Negative Setpoint Limit} = \text{Nominal} * 1 -
\frac{\text{Negative}}{100} - \text{Load Line} * \text{ILoad} \] \[
\text{Overshoot Limit} = \text{Nominal} * 1 +
\frac{\text{Overshoot}}{100} - \text{Load Line} * \text{ILoad} \] \[
\text{Undershoot Limit} = \text{Nominal} * 1 -
\frac{\text{Undershoot}}{100} - \text{Load Line} * \text{ILoad}
\] |
| Plot load line
curves? |
If checked, curves
representing the minimum and maximum output voltage specification will be
added to the output voltage graph. |
| Tolerances: Specifications
for output voltage tolerances |
| Positive |
Maximum positive percentage
tolerance for the output voltage setpoint |
| Negative |
Maximum negative percentage
tolerance for the output voltage setpoint |
| Overshoot |
Maximum percentage
tolerance for the output voltage overshoot |
| Undershoot |
Maximum percentage
tolerance for the output voltage undershoot |
| Peak to Peak |
Maximum allowed
peak-to-peak voltage at the output |
| Current: Specifications for
output current |
| Maximum |
Maximum output current at
100% load |
This parameter is a Symbolic Value
which can be used in a testplan. |
| Light Load: Specifications
for minimum output current |
| @ Input 1 min |
Light load specification
where POP analysis will succeed when Input 1 is at its minimum
voltage |
These parameters are Symbolic Values
which can be used in a testplan. |
| @ Input 2 max |
Light load specification
where POP analysis will succeed when Input 1 is at its maximum
voltage |
| Misc: Appears only when you
have an AC Input |
| Dropout Spec |
Minimum output voltage
specification for Line
Dropout test objective. |
▲ back to top
DC/DC Objectives
The DC/DC objectives section has seven sub categories of parameters:
Although you can use the DC/DC objectives on an AC/DC converter, you should also see the
specialized . The DC/DC Objectives require at least one DC or AC input source and one
output load. You can add these to your design on the Circuit
Specifications page.
POP Analysis
The POP
Analysis page allows you to define parameters for the Periodic Operating Point
simulations used in the DC/DC test objectives. Each test objective, with the exception
of the Startup objective, uses a POP analysis to find
the steady-state operating point of the converter. When you first place a control
symbol, these analysis parameters are automatically read from the schematic and saved on
the control symbol. The DVM ▶Reset Analysis Parameters menu performs this action
as well.
Note: A successful POP run is a prerequisite for AC analyses and for all
DC/DC objectives except the Startup test objective.
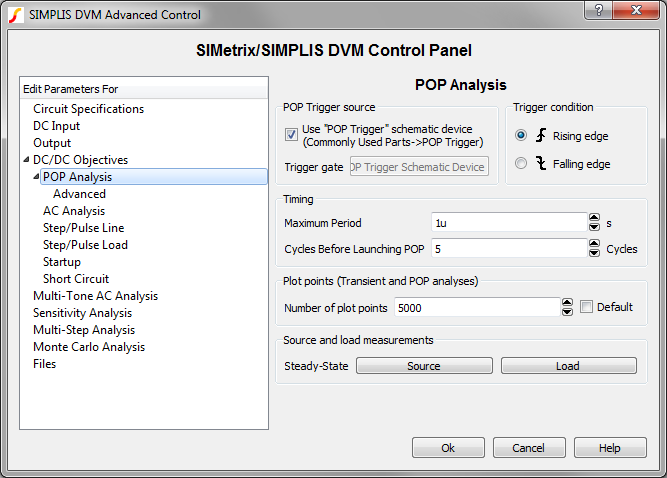
| Simulation Parameters |
| POP Trigger Source |
Device name of a defined logic
gate considered the triggering gate of the POP analysis |
| Trigger Condition |
Trigger condition that defines
the beginning of a new switching cycle for the POP analysis |
| Maximum Period |
Defines the maximum period, or
lowest frequency, where POP looks for a steady-state solution |
| Cycles Before Launching
POP |
The number of POP trigger
events before starting the Core POP Process. |
| Number of plot points |
The number of points the
simulation uses. SIMPLIS automatically adds plot points when a PWL device
changes state or when a logic signal or switch changes state. |
For more information on the POP analysis, see the Advanced SIMPLIS Training
topic 2.3.1
Overview of the Periodic Operating Point (POP) Analysis.
▲ back to top
POP Advanced
Options
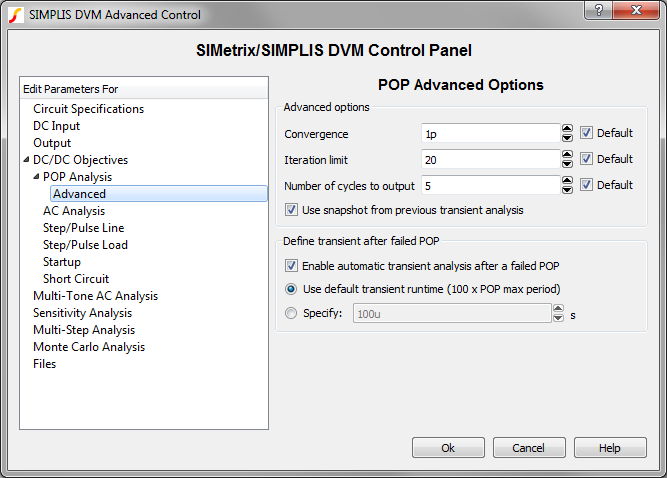
| Advanced Options |
| Convergence |
The maximum percent change
in any inductor current or capacitor voltage from one POP trigger edge to
the next |
| Iteration limit |
The maximum number of
passes through the core POP process |
| Number of cycles to
output |
The number of POP periods
to display on the waveform viewer |
| Use snapshot from previous
transient analysis |
If checked, a valid
snapshot will be loaded from a previous transient analysis. |
| Enable automatic transient
after a failed POP |
If checked, a transient
analysis will be run after a failed POP run. |
| Use default transient
runtime (100 x POP max period) |
If selected, the transient
analysis will run for 100 times the maximum POP period. |
| Specify |
If selected, the transient
analysis will run for the specified number of seconds. |
For more information on the advanced POP options, see the Advanced SIMPLIS
Training topic 2.3.2
The Core POP Process.
AC
Analysis
The AC Analysis page allows you to define simulation parameters for
the three AC test objectives:
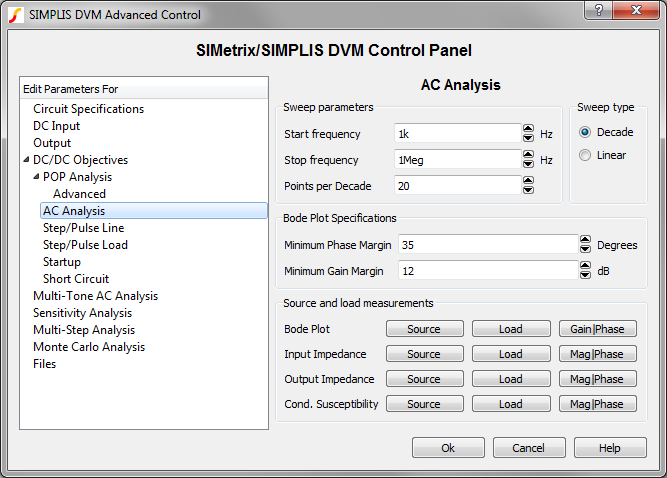
| Simulation Timing:
BodePlot, Impedance and ConductedSusceptibility test objectives |
| Start Frequency |
Start frequency for AC
analyses |
| Stop Frequency |
Stop frequency for AC
analyses |
| Sweep Type |
AC sweep type: Decade or
Linear |
| Points per Decade |
Number of points per
decade, or the total number of points for a linear sweep. |
| Bode Plot
Specifications |
| Minimum Phase
Margin |
Minimum phase margin
specification for BodePlot test objective. |
| Minimum Gain Margin |
Minimum gain margin
specification for BodePlot test objective. |
| Source and load
measurements |
| Bode Plot |
The Source and Load buttons
allow you to select voltage and current measurements for each of these
test objectives. The Gain|Phase and Mag|Phase buttons allow you to select
magnitude and phase measurements. |
| Input Impedance |
| Output Impedance |
| Cond.
Susceptibility |
For more information on these parameters, see Chapter 11, SIMPLIS-FX, in the
SIMPLIS Reference
Manual
. If your circuit is pre-configured to run an AC analysis when you place the DVM
control symbol, these values will automatically be extracted from your
schematic.
▲ back to top
Step/Pulse
Line
The Step/Pulse Line Test Objectives page allows you to set the simulation
timing to use for the Step Line and Pulse Line test objectives.
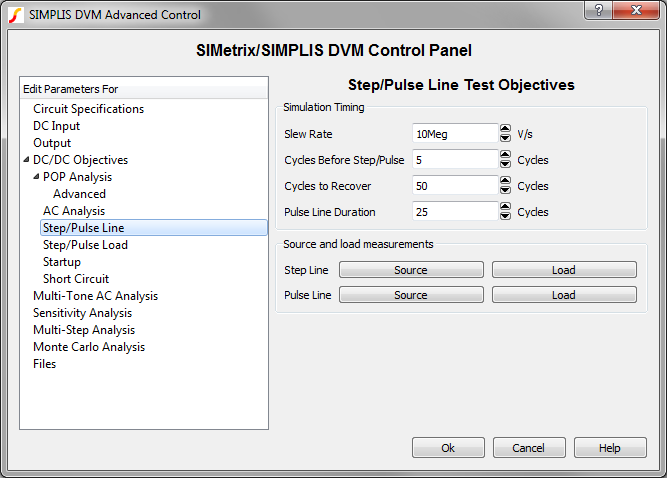
| Simulation Timing |
| Slew Rate |
The slew rate of the line
voltage step or pulse in V/s |
| Cycles Before Event |
Combined with the nominal
switching frequency, this parameter determines the length of time before the
start of the line transient. |
| Cycles to Recover |
Combined with the nominal
switching frequency, this parameter determines the length of time that the
circuit has to recover after the end of the line transient. |
| Pulse Line Duration |
The time duration of the line
pulse expressed in the number of switching cycles |
▲ back to top
Step/Pulse
Load
The Step/Pulse Load Test Objectives page allows you to set the simulation
timing to use for the Step Load and Pulse Load test objectives.
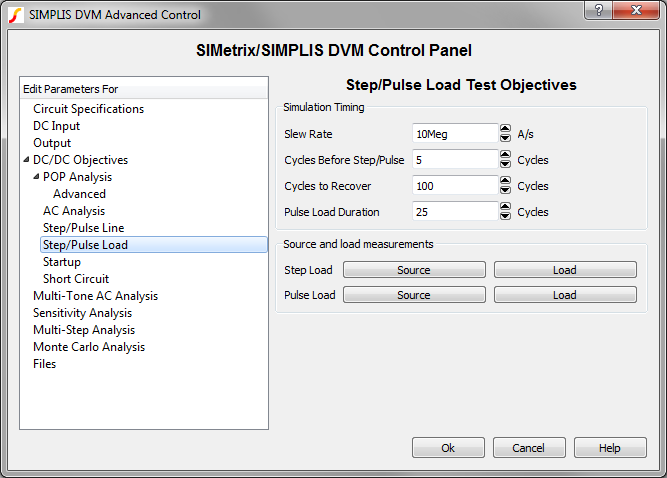
| Simulation Timing |
| Slew Rate |
The slew rate of the load
current step or pulse in A/s |
| Cycles Before Event |
Combined with the nominal
switching frequency, this parameter determines the length of time before the
start of the load transient. |
| Cycles to Recover |
Combined with the nominal
switching frequency, this parameter determines the length of time that the
circuit has to recover after the end of the load transient. |
| Pulse Load Duration |
The time duration of the load
pulse expressed in the number of switching cycles |
| Source and load
measurements |
| Step Line |
The Source and Load buttons
allow you to select voltage and current measurements for each of these test
objectives. |
| Pulse Line |
▲ back to top
Startup
The
Startup Test Objective page allows you to set the simulation timing for the Startup Test Objective.
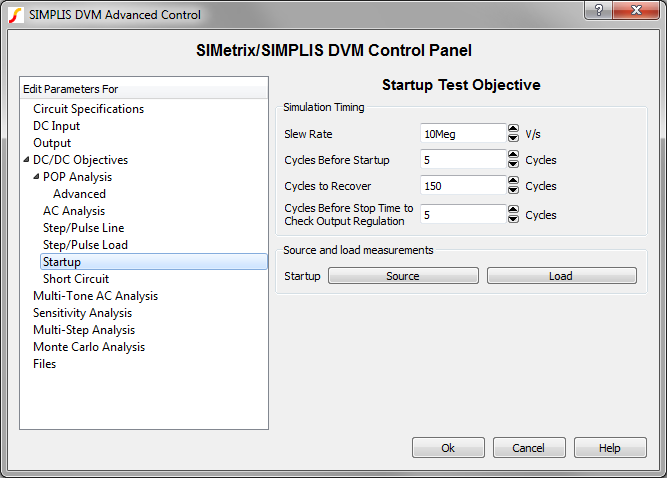
| Simulation Timing |
| Slew Rate |
The slew rate of the input
voltage source in V/s |
| Cycles Before Event |
Combined with the nominal
switching frequency, this parameter determines the length of time before the
start of the startup transient. |
| Cycles to Recover |
Combined with the nominal
switching frequency, this parameter determines the length of time that the
circuit has to recover after the end of the startup transient. |
| Cycles Before Stop Time to
Check Output Regulation |
Combined with the nominal
switching frequency, this parameter determines the length of time at the end
of the simulation in which the circuit is examined to determine that it is
in regulation. |
| Source and load
measurements |
| Startup |
The Source and Load buttons
allow you to select voltage and current measurements for this test
objective. |
▲ back to top
Short
Circuit
The Short Circuit Test Objective page allows you to set the simulation
timing and short circuit resistance parameters for the Short
Circuit test objective.
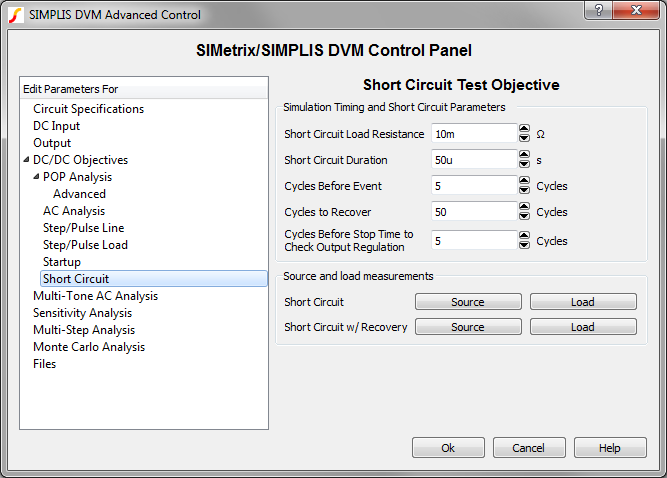
| Simulation Timing and Short
Circuit Parameters |
| Short Circuit Load
Resistance |
ON resistance of the switch
used to implement the short circuit |
| Short Circuit Duration |
Length of the short circuit
event in seconds |
| Cycles Before Event |
Combined with the nominal
switching frequency, this parameter determines the length of time before the
start of the short circuit. |
| Cycles to Recover |
Combined with the nominal
switching frequency, this parameter determines the length of time that the
circuit has to recover after the end of the short circuit. |
| Cycles Before Stop Time to
Check Output Regulation |
Combined with the nominal
switching frequency, this parameter determines the length of time at the end
of the simulation in which the circuit is examined to determine that it is
in regulation; applies only to Short Circuit and Recover tests. |
| Source and load
measurements |
| Short Circuit |
The Source and Load buttons
allow you to select voltage and current measurements for each of these test
objectives. |
| Short Circuit w/
Recovery |
▲ back to top
AC/DC Objectives
The AC/DC Objectives section has six sub categories of parameters:
The DC/DC Objectives can also be applied to AC/DC converters if the converter is
designed to perform a POP analysis.
Find AC Steady-State
The Find
AC Steady-State Test Objective page allows you to define the simulation timing for
the FindACSteadyState Test Objective.
This test objective runs a long transient simulation and saves an initial-conditions
file with the GenerateInitFile testplan
entry. This initial-conditions file is then loaded into a future simulation to
initialize the converter to a steady-state condition. The timing parameters here
reference the F_LOW and F_HIGH symbolic
values which are defined on the AC
Input page.
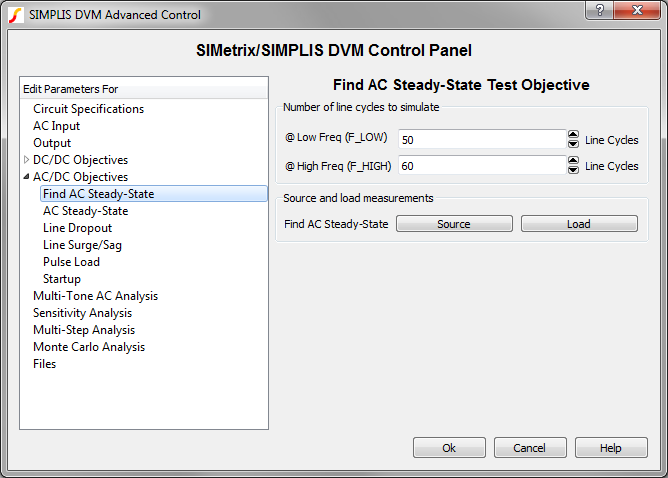
| Number of line cycles to
simulate: Timing parameters that determine length of transient simulation
for the Find AC Steady-State test objective |
| @Low Freq (F_LOW) |
Number of line cycles to
simulate in order to find the steady-state operating point of the circuit
at the lower frequency. The default values result in a stop time of
1s. |
| @High Freq (F_HIGH) |
Number of line cycles to
simulate in order to find the steady-state operating point of the circuit
at the higher frequency. The default values result in a stop time of
1s. |
| Source and load
measurements |
| Find AC
Steady-State |
The Source and Load buttons
allow you to select voltage and current measurements for this test
objective. |
▲ back to top
AC Steady-State
The AC Steady-State test objective measures
the performance of the converter under steady-state input voltage and output-load
conditions. The converter is typically initialized to a steady state with an IncludeInitFile testplan entry. This includes
an initial-conditions file from a FindAcSteadyState simulation. For additional details, see the AcSteadyState test objective topic.
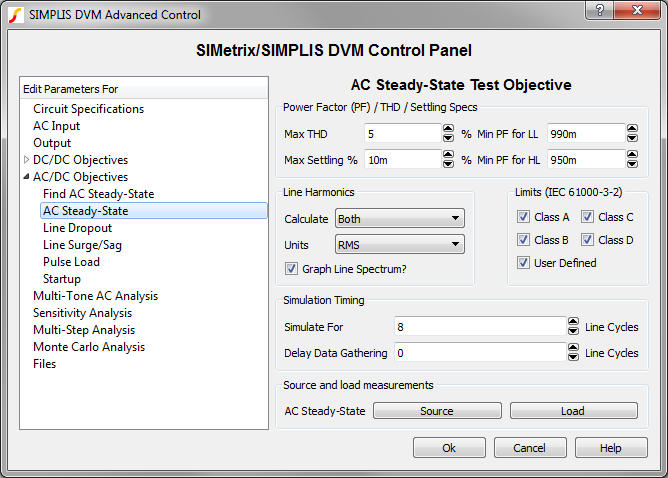
| Power Factor (PF) / THD /
Settling Specs: Specifications for the AC steady-state analyses |
| Max THD |
Maximum total harmonic
distortion allowed for input source, specified as a percentage of the
fundamental |
| Max Settling |
Maximum percent difference
between the mean values of the output voltage over the last two lines
cycles |
| Min PF for LL |
Minimum power factor for
low-line tests |
| Min PF for HL |
Minimum power factor for
high-line tests |
| Line Harmonics: Options to
configure how line harmonics are presented in the DVM report |
| Calculate |
Select the line harmonics
for which you want to generate scalar values for the DVM report; the menu
options are None, Odd, Even, Both. |
| Units |
The units for the reported
line harmonic scalar values; the menu options are RMS, % Fundamental,
mA/W. |
| Graph Line
Spectrum? |
If checked, DVM will
generate a plot of the line harmonics for the AC input source.
- If any check boxes are selected in the Limits (IE 61000-3-2)
section, plots are generated in the units specific to those limits.
- If no limits are selected, a single line current spectrum graph
will be generated in the units selected from the Units drop-down
menu.
|
| Limits (IEC 61000-3-2):
Specifications for line harmonic current limits |
| Class A |
If checked, measured line
harmonic currents will be compared with IEC 61000-3-2 Class A harmonic
limits. |
| Class B |
If checked, measured line
harmonic currents will be compared with IEC 61000-3-2 Class B harmonic
limits. |
| Class C |
If checked, measured line
harmonic currents will be compared with IEC 61000-3-2 Class C harmonic
limits. |
| Class D |
If checked, measured line
harmonic currents will be compared with IEC 61000-3-2 Class D harmonic
limits. |
| User Defined |
If checked, measured line
harmonic currents will be compared with the user-specified limits. The
limits are defined in a simple plain text file. For a full description,
see the AC/DC Harmonic
Specifications. |
| Simulation Timing:
Parameters that determine the length of the simulation and when to start
collecting waveform data |
| Simulate For |
Number of lines cycles to
simulate after the Data Gathering Delay. In combination with the
line frequency, this determines the stop time of the simulation. |
| Delay Data
Gathering |
Number of line cycles
before data generation starts. Usually this can be set to zero if the
initial-conditions file is accurate |
| Source and load
measurements |
| AC Steady-State |
The Source and Load buttons
allow you to select voltage and current measurements for this test
objective. |
▲ back to top
Line Dropout
The Line Dropout Test Objective page allows you to define
parameters for the LineDropout test.
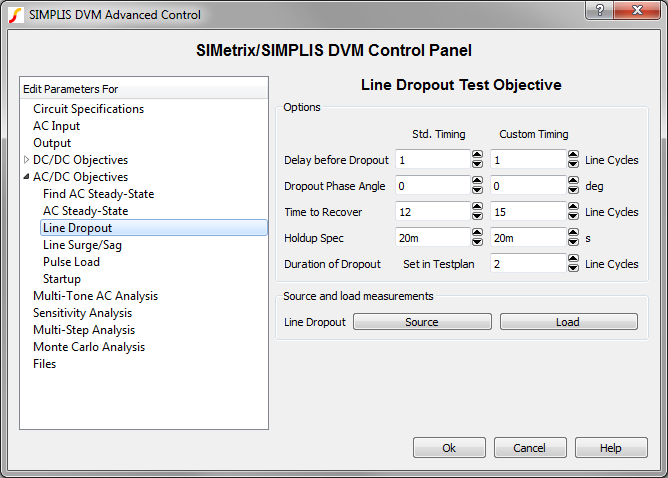
| Standard Timing |
| Delay before
Dropout |
Number of full line cycles
before dropout initiation |
| Dropout Phase Angle |
The phase angle, in
degress, when the line drop out starts |
| Time to Recover |
Number of line cycles to
simulate after the line returns to normal |
| Holdup Spec |
Maximum holdup time
specification for all outputs |
| Custom Timing |
| Delay before
Dropout |
Number of full line cycles
before dropout initiation |
| Dropout Phase Angle |
The phase angle, in
degrees, when the line dropout starts |
| Time to Recover |
Number of line cycles to
simulate after the line returns to normal |
| Holdup Spec |
Maximum holdup time
specification for all outputs |
| Duration of Dropout |
Duration of the dropout in
line cycles |
| Source and load
measurements |
| Line Dropout |
The Source and Load buttons
allow you to select voltage and current measurements for this test
objective. |
▲ back to top
Line Surge/Sag
The Line Surge/Sag Test Objective page allows
you to define parameters for the LineSurge and
LineSag test objectives.
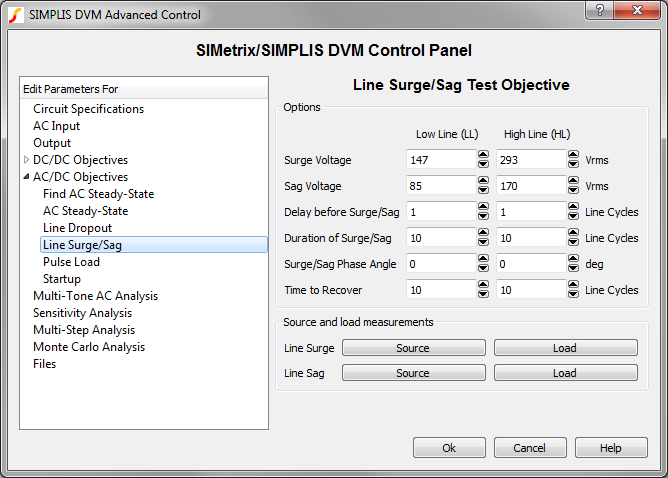
| Options: Low Line (LL) and
High Line (HL) |
| Surge Voltage |
Voltage, in volts RMS, to
which the line surges for LineSurge test objectives |
| Sag Voltage |
Voltage, in volts RMS, to
which the line sags for LineSag test objectives |
| Delay before
Surge/Sag |
Number of full line cycles
to simulate before initiating the line surge or line sag |
| Duration of
Surge/Sag |
Duration, in line cyles, of
surge or sag |
| Surge/Sag Phase
Angle |
The phase angle at which
the line surge or sag is initiated |
| Time to Recover |
Number of line cycles to
simulate after the line returns to normal |
| Source and load
measurements |
| Line Surge |
The Source and Load buttons
allow you to select voltage and current measurements for these test
objectives. |
| Line Sag |
▲ back to top
Pulse Load (AC Line Timing)
The Pulse Load (AC Line
Timing) Test Objective page allows you to define the timing parameters for the LoadTrAC Test Objective.
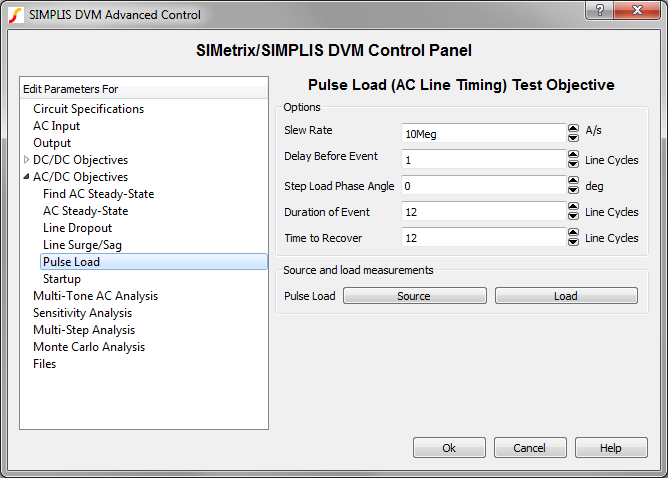
| Options |
| Slew Rate |
Maximum slew rate, in A/s,
at which the load current changes |
| Delay before Event |
Number of full line cycles
to simulate before initiating the load pulse |
| Step Load Phase
Angle |
Line phase angle at which
the load pulse is initiated |
| Duration of Event |
Duration, in line cycles of
the load pulse |
| Time to Recover |
Number of line cycles to
simulate after the load returns to the non-pulse amplitude |
| Source and load
measurements |
| Pulse Load |
The Source and Load buttons
allow you to select voltage and current measurements for this test
objective. |
▲ back to top
Startup
The AC
Startup Test Objective page allows you to change timing specifications for the LineStartup and ControlStartup test objectives.
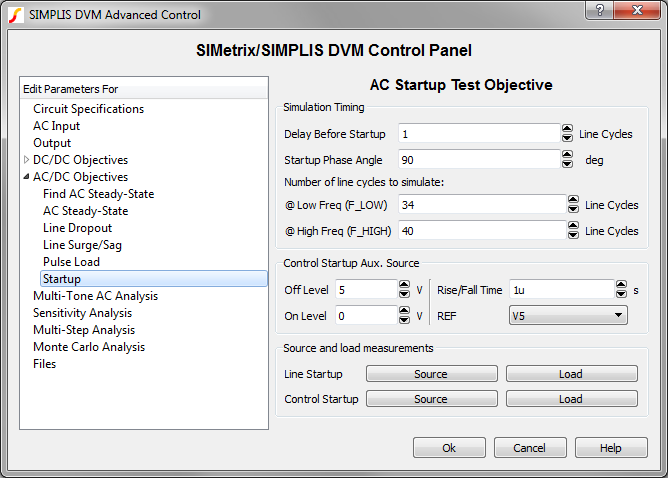
| Simulation Timing: |
| Delay Before
Startup |
Number of full line cycles
to delay start up |
| Startup Phase Angle |
Phase angle at which the
line or control startup occurs |
| Number of line cycles to
simulate |
| @Low Freq (F_LOW) |
Number of line cycles to simulate at low frequency. This value is used
to calculate the stop time that is determined by dividing this number
by the F_LOW value specified on the AC Input page. For example, if
this value is 34 and the value on the AC Input page is 50 Hz, the stop
time is 680ms.
|
| @High Freq (F_HIGH) |
Number of line cycles to simulate at high frequency. This value is
used to calculate the stop time that is determined by dividing this
number by the F_HIGH value specified on the AC Input page. For
example, if this value is 40 and the value on the AC Input page is 60
Hz, the stop time is 666.667ms.
|
| Control Startup Aux.
Source |
| Off Level |
The voltage level where the
control input disables the converter |
| On Level |
The voltage level where the
control input enables the converter |
| Rise/Fall Time |
The rise or fall time for
the source |
| REF |
The reference designator
for the control source. The schematic symbol must be a DVM Aux
source. |
| Source and load
measurements |
| Line Startup |
The Source and Load buttons
allow you to select voltage and current measurements for these test
objectives. |
| Control Startup |
▲ back to top
Multi-Tone AC Analysis
The
Multi-Tone AC Analysis page allows you to define parameters for the Multi-Tone AC
Analysis, which is an alternative to the conventional POP/AC Analysis and it does not
require a circuit to have a POP solution. The Multi-Tone AC Analysis is compatible with
both DC/DC and AC/DC converters. Since this is a complicated analysis, you should read
the Multi-Tone AC Analysis - Introduction and the Multi-Tone AC Analysis Theory topics before attempting to apply this analysis to a converter.
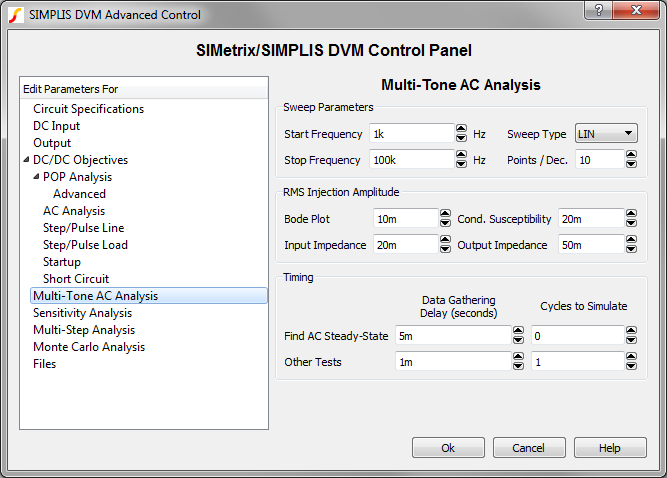
| Sweep Parameters |
| Start Frequency |
The lowest injection frequency
for the Multi-Tone Sweep. Because this input also sets the total simulation
time in integer multiples of 1/Start Frequency, you should avoid extremely
low start frequencies. For details, see the Timing table
below. |
| Stop Frequency |
The highest injection
frequency for the Multi-Tone Sweep |
| Sweep Type |
The following sweep types are
available:
-
LIN sets a linear sweep of frequencies starting at the Start
Frequency. This sweep will include every harmonic of the Start
Frequency up to and including the Stop Frequency.
-
DEC approximates a decade sweep between Start Frequency and
Stop Frequency with no more points than the value of Points/Dec.
-
DEC2 applies a combination of the LIN and DEC sweeps: the first
decade consists of linear-spaced frequencies, and subsequent decades
use the DEC method.
All sweeps are limited to
100 frequencies. This limits the LIN sweeps to two decades, whereas the
DEC and DEC2 sweeps can be used for four or more decades. For details,
see Points/Dec. below.
|
| Points/Dec. |
The maximum number of points
for DEC and DEC2 sweeps; not used for LIN sweep types.
As more frequencies are injected, the signal-to-noise ratio in the system
decreases and the AC output waveforms become noisier. Additionally, a high
number of injected frequencies will slow down the simulation considerably.
For this reason, using as few frequencies as possible produces the best
results. |
| Timing |
| Data Gathering Delay: Find AC
Steady-State |
This parameter sets the time
delay before data is generated during Find AC Steady-State tests. The
Data Gathering Delay time needs to be set to allow the circuit to
settle completely into a steady state. For the Fourier analysis to yield
noise-free results, the circuit must be
completely
settled; therefore, set this time delay generously. |
| Data Gathering Delay: Other
Tests |
This parameter sets the time
delay before data is generated for all tests except Find AC Steady-State.
Typically, the initial-conditions file generated from a Find AC Steady-State
test will be extremely close to the circuit's steady state and this delay
can be set to zero. If there is some residual transient, this delay can be
set to allow the circuit to settle before simulation data is
generated. |
| Cycles to Simulate: Find AC
Steady-State |
Find AC Steady-State data will
be collected for this number of Start Frequency cycles after the
Data Gathering Delay. The Find AC Steady-State tests generate an
initial-conditions file. The only reason to make this parameter non-zero is
if you wish to observe the settling behavior of the converter. |
| Cycles to Simulate: Other
Tests |
In conjunction with the
Start Frequency and the Data Gathering Delay: Other Tests,
this parameter determines the simulation stop time:
- Start Frequency
- Data Gathering Delay: Other Tests
- This parameter (Cycles to Simulate: Other Tests)
\[ \text{Simulation Stop Time} = \frac{\text{Cycles to Simulate: Other
Tests}}{\text{Start Frequency}} + \text{Data Gathering Delay: Other Tests}
\] The simulation time span
is then determined as follows:
\[ \text{Simulation Time Span} =
\frac{\text{Cycles to Simulate: Other Tests}}{\text{Start Frequency}} \] For example, if the
Cycles to Simulate is 2 and the Start Frequency is 1kHz,
the simulation will have 2ms of simulated data. The Simulation Time Span
will always be an integer multiple of the lowest period: \[
\frac{\text{1}}{\text{Start Frequency}} \]
|
Sensitivity/Worst-Case
Analysis
Sensitivity and
Worst-Case Analysis is a special analysis used to evaluate the effect of parameter
variation on converter performance. The analysis is described in detail in the DVM Sensitivity and Worst-Case Analysis topic. The
dialog is described below.
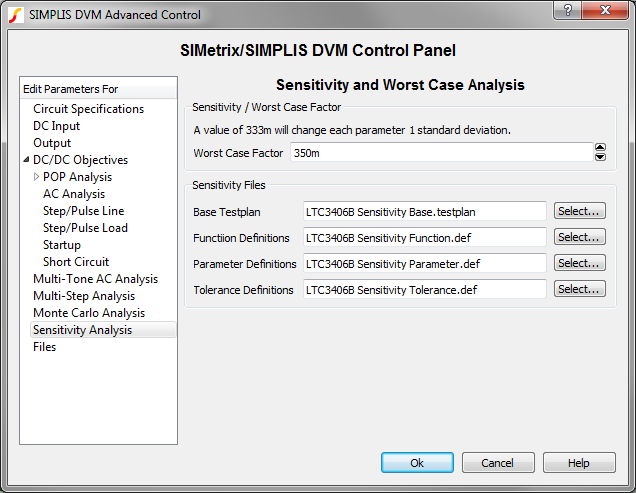
| Sensitivity / Worst Case
Factor |
| Worst Case Factor |
During sensitivity analysis,
each design parameter is increased by an amount equal to the worst-case
factor multiplied by the user-defined tolerance. A value of 333m represents
a change of one standard deviation in the positive direction. |
| Sensitivity Files |
| Base Testplan |
Select the sensitivity base
testplan for this schematic. This is the tesplan is used for sensitivity and
worst-case analyses. |
| Function Definitions |
Select the function definition
file for the sensitivity analysis. |
| Parameter Definitions |
Select the parameter
definition file for the sensitivity analysis. |
| Tolerance Definitions |
Select the tolerance
definition file for the sensitivity analysis. |
▲ back to top
Multi-Step Analysis
The DVM Multi-Step Analysis allows you to step a set of design
parameters over a range of values using a decade-step or linear-step sequence. You may also
step values over a defined list of parameter values. One advantage of using a single test
with a multi-step analysis over multiple DVM tests is the multi-core capability which is
part of the Pro and Elite license packages. The multi-core capability runs steps in
parallel on multiple processor cores and will greatly reduce the simulation time required
for the multi-step analysis. Even using a single processor core reduces the required
simulation time as the schematic is setup once, as is the graph and data collection after
the simulation completes.
For more information, see the Multi-Step Analysis topic.
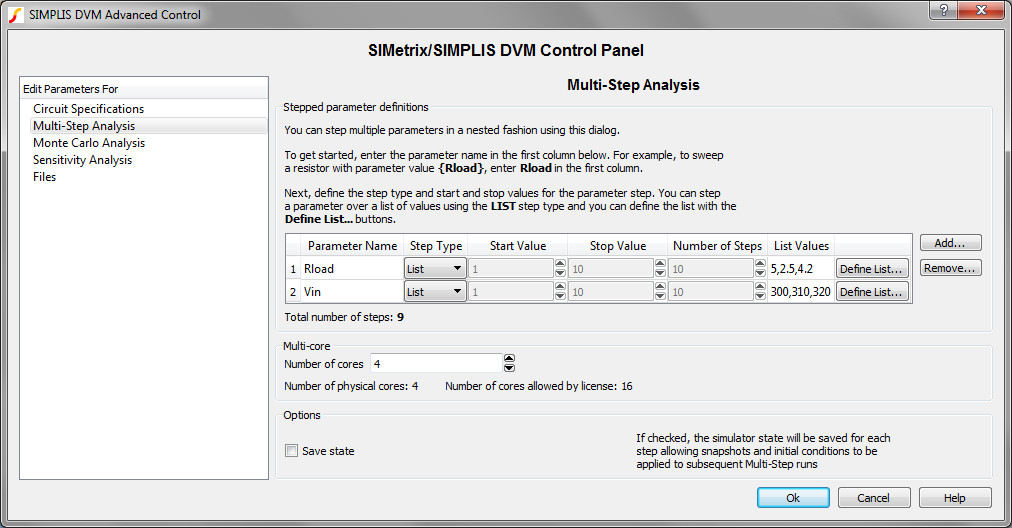
The table on the Multi-Step Analysis page allows you to enter the parameter names and
their associated step parameters. The dialog allows you to configure three different
step modes:
- A Linear step where the parameter is stepped from the Start Value
to the Stop Value using the Number of Steps in a linearly spaced
sequence. The number of steps run will always be the parameter entered into the
Number of Steps field.
- A Decade step where the parameter is stepped from the Start Value
to the Stop Value using the Number of Steps
per decade in a logarithmic sequence. The total number of steps depends on
the Start Value, Stop Value, and the Number of Steps.
- A List sequence where the parameter is stepped over a user-defined list of
parameter values. There are no restrictions on the values of the list. The total
number of steps depends only on the number of values entered.
To enter parameter step information, follow these steps:
- Enter a parameter name in the Parameter Name column.
- Select the desired Step Type from the drop-down list. After you select the
step type, the rest of the valid controls for this parameter are enabled.
- For List step types, enter the list of values by double clicking on the
List Values table cell or click on the Define List...
button.
| Table Column |
Description |
| Parameter Name |
The name of the stepped
parameter. The schematic symbols should be parameterized with this
parameter name using braced {} substitutions as shown at the top of the
dialog image above. Note: You can automatically change symbol property
values by using the Change testplan entry.
|
| Step Type |
The step type can be one of
the following:
-
Decade: The stepped parameter is stepped
logarithmically.
-
Linear: The stepped parameter is stepped in a linear
fashion.
-
List:The parameter is stepped over a list of values. To
define the list, click the Define List... button.
|
| Start Value |
The starting value for the
parameter step, used with decade and linear steps |
| Stop Value |
The ending value for the
parameter step, used with decade and linear steps |
| Number of Steps |
The number of steps for the
decade or linear steps. For decade steps, this parameter value is the
number of steps per decade, for linear steps, the parameter value is the
number of equally spaced steps. |
| List Values |
The list of stepped values.
This cell is automatically populated by the dialog opened with the
Define List... button. |
Additional parameters can be stepped by clicking on the Add... button
and individual parameters can be removed with the Remove... button. The total
number of steps is the product of number of steps for each stepped parameter. The
total number of steps is calculated and shown below the table in the Total number
of steps text.
Note: Parameters in the table with an empty parameter name
are not saved when you accept the dialog.
| Multi-core |
| Number of cores |
The number of cores used
for the simulation. The Pro and Elite licenses allow the use of 4 and 16
cores respectively. |
| Save state |
If checked, SIMPLIS will save initial
conditions files with names which reflect the stepped parameter values.
You can use the GenerateInitFile
entry to save the initial conditions files and the IncludeInitFile entry to include
these files. |
▲ back to top
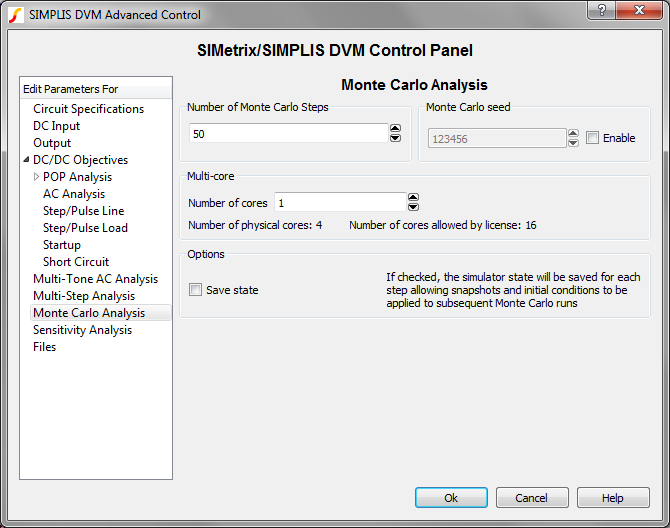
Monte Carlo Analysis
The Monte Carlo analysis allows you to investigate the effect of
random parameter value changes on your circuit. The Monte Carlo analysis assumes that you
have set up your circuit with statistical parameter distribution functions.
For more information, see the Monte Carlo Analysis topic.
| Parameters |
| Number of Monte Carlo
Steps |
The number of steps, or
simulations, to run |
| Monte Carlo Seed |
The seed value for the Monte
Carlo simulation. The seed value starts the pseudo-random number generator
at a specific value. Subsequent seeds follow a predictable pattern, which
makes the Monte Carlo simulation repeatable. |
| Multi-core |
| Number of cores |
The number of cores used for
the simulation. The Pro and Elite licenses allow the use of 4 and 16 cores
respectively. |
| Save state |
If checked, SIMPLIS will save initial
conditions files with names which match the Monte Carlo seed values. You can
use the GenerateInitFile entry to
save the initial conditions files and the IncludeInitFile entry to include these
files. Important: You must enable and provide a starting seed
to include the initial conditions files.
|
▲ back to top
Files Page
The Files page allows you to do the following:
- Assign a default testplan
- Customize the appearance of the simulation reports
- Add Pre-process and Post-process
scripts to be run on every simulation
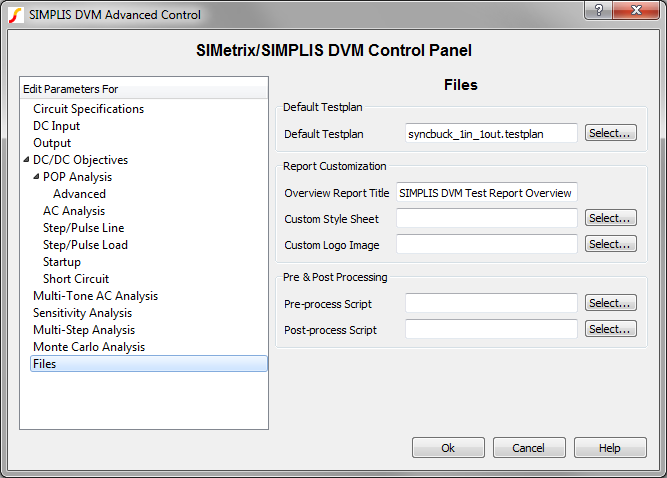
| Default Testplan: used
when you select either DVM ▶ Run Schematic's Default Testplan or DVM ▶
Run Entire Schematic's Default Testplan from the menu bar. |
| Default Testplan |
Specifies the default
testplan to be used with this schematic. |
| Report Customization:
Options to customize the appearance of the DVM report |
| Overview Report
Title |
The title used on the
overview report. The titles for individual test reports can be changed
with the HTMLTitle testplan
entry. |
| Custom Style Sheet |
Cascading Style Sheet (CSS
file) to use with the DVM report |
| Custom Logo Image |
Portable Network Graphics
(PNG) file to use with the DVM report |
| Pre & Post
Processing |
| Pre-process Script |
SIMetrix script to be
executed immediately before launching each simulation; this allows you to
change schematic values or analysis statements before running the test.
Preprocess scripts are executed after all Objective entries are
processed which allows users to override any schematic changes made by
DVM. |
| Post-process Script |
SIMetrix script to be
executed immediately after each simulation successfully completes; this
allows you to perform waveform manipulation and to create custom scalar
and specification values. |
▲ back to top