Distribution Function
Returns a random number with a distribution defined by a lookup table. This function is intended to be used for SIMPLIS Monte Carlo analyses and would typically be used in device value expressions.
This function is only available in the Simulator process and cannot be called from scripts running in the context of the front end. The function is only active when used by the netlist pre-processor with Monte Carlo analysis enabled. When used in other contexts, the function returns 1.0.
A similar function is available for SIMetrix Monte Carlo analyses, but the syntax is slightly different. Refer to the Simulator Reference Manual for further details.
Arguments
| Number | Type | Compulsory | Default | Description |
| 1 | real | Yes | Tolerance | |
| 2 | real array | Yes | Distribution definition |
Argument 1
Tolerance - in effect scales the extent of the distribution defined in argument 2.
Argument 2
Lookup table organised in pairs of values.
The first value in the pair is the deviation. This should be in the range +1 to -1 and maps to the output range. So +1 corresponds to an output value of +tolerance and -1 corresponds to -tolerance. Each deviation value must be greater than or equal to the previous value. Values outside the range +/- 1 are allowed but will result in the function being able to return values outside the tolerance range.
The second value in the pair is the relative probability and must 0 or greater.
There is no limit to the number of entries in the table
Returns
Return type: real
Notes
.VAR binomial = {[-1,1, -0.5,1, -0.5,0, 0.5,0, 0.5,1, 1,1]}
The above can be placed in the F11 window of a SIMPLIS schematic. Then to access a binomial distribution
for a component value, use something like:
{ 1k * distribution(0.1, binomial) }
The above defines a value of 1k with a 10% tolerance using the binomial
distribution defined by the lookup table 'binomial'.
The function
UD
is an alias to this function and may be more convenient.
See Also
Example
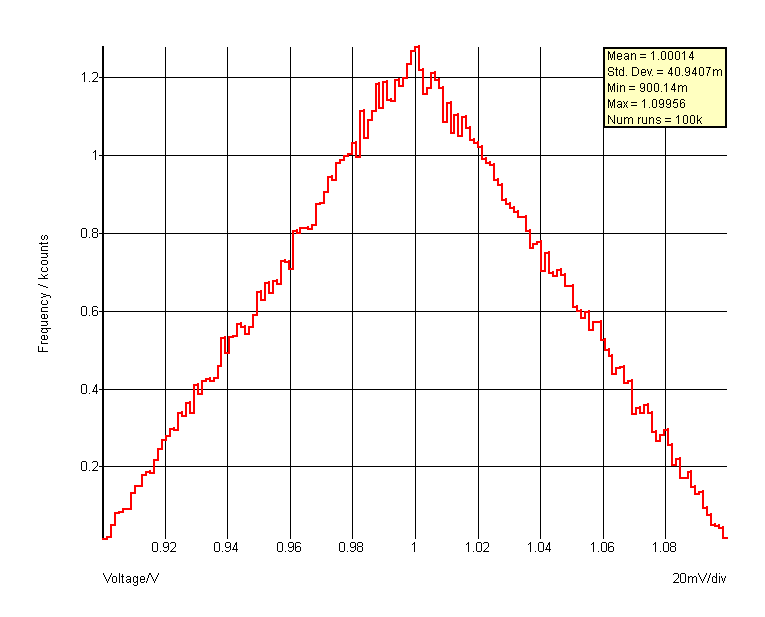
distribution(1.0, [-1,0, 0,1, 1,0] ) - see graph below:
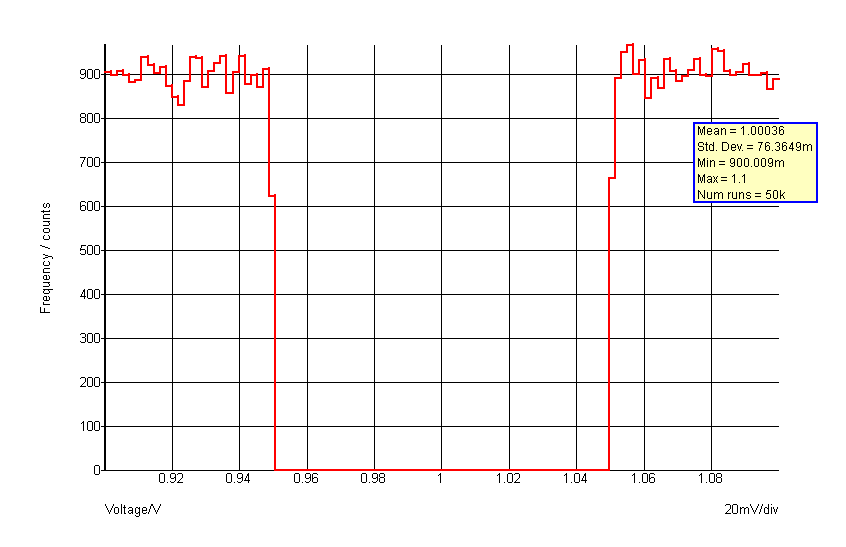
 distribution(1.0, [-1,1, -0.5,1, -0.5,0, 0.5,0, 0.5,1, 1,1] )
| ▲Function Summary▲ | ||
| ◄ DirectoryIsWriteable | EditArcDialog ▶ | |