Sensitivity/Worst-case Example
- Open the schematic EXAMPLES/MonteCarlo/cheb2.sxsch if not already
- Select menu Simulator | Choose Analysis...
- In the AC sheet, in the Monte Carlo and multi-step analysis group, click the Define... button.
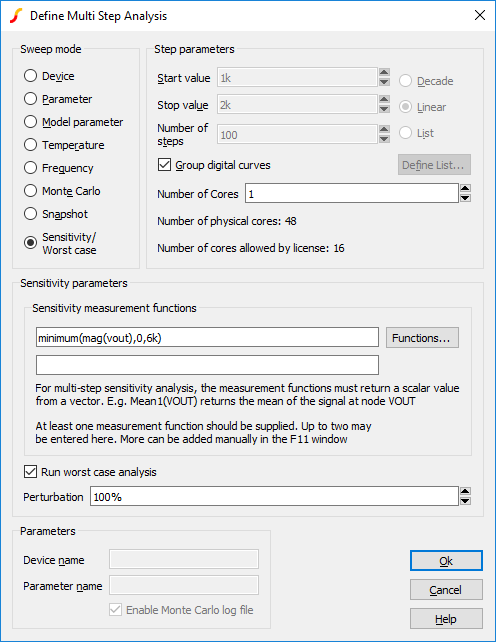
- Click on Sensitivity/Worst case in the Sweep mode group.
- Enter "minimum(mag(vout),0,6k)" as the first entry in the Sensitivity measurement functions group.
- Check the Run worst case analysis button.
-
Ok dialog boxes, then run simulation in the usual way. You should now see this:
Run the analysis in the usual way. You should see a graph like the following:
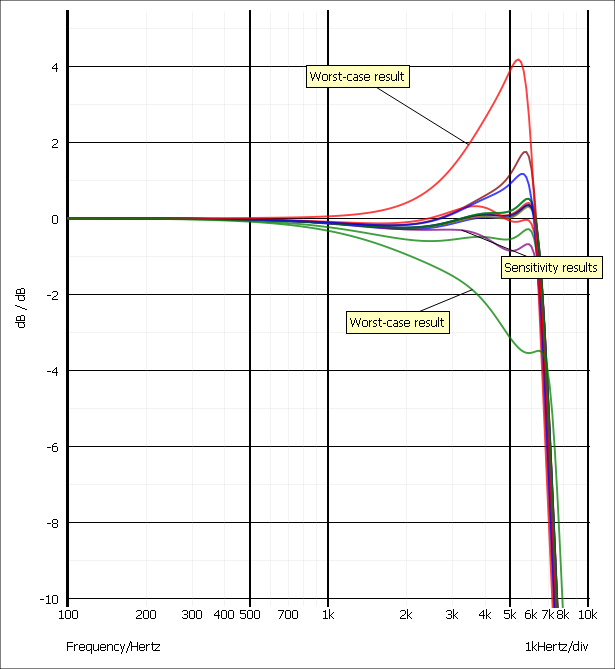
The outlying green and red curves are the worst-case results while the remaining curves are the sensitivity results. Each of the sensitivity curves is the result of running the simulation with a single component value perturbed so that it is set to its highest value within the tolerance specification. The worst-case curves are the result of running the simulation with all components perturbed at one or other tolerance extreme. Which extreme to use is determined from an analysis of the sensitivity results so as to maximise and minimise the sensitivity measurement function.
Note that the results show deviation from our 3dB specification. So, although our previous Monte Carlo analysis showed that typical production yields should be within our specification, there are some extreme combinations of components that will lead to a result substantially outside the specification.
To resolve this we can tighten the specification of some components and to do this we first examine the sensitivity report. The report details the results of evaluating the sensitivity measurement functions along with the component values used.
To view the sensitivity report, select menu Simulator | Reports | Sensitivity. You should see the following:
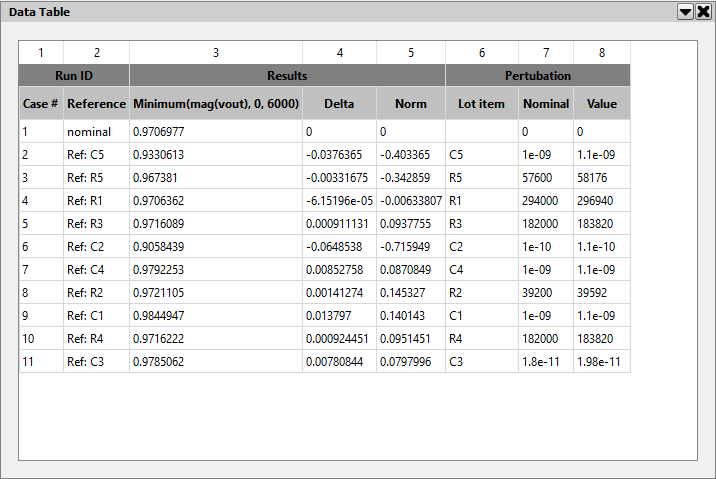
The Delta column shows the deviation from the nominal for each case. Double-click the Delta label in the header. This will sort the results in order of magnitude and so show which cases had the greatest effect. Note that C2 and C5 are at the top of the list. We will now tighten the tolerance on these parts to 2%. To do this:
- Select C2 and C5
- Select menu Mote Carlo | Set Selected Component Tolerances...
- Enter 2% then Ok to close
- Re-run simulation
You should see that the result is now within specification. Changing R5 and C5 to 576K and 100p respectively does not significantly affect the result and means that there is only one tight-tolerance capacitor value in the circuit of 100p.
| ◄ A Monte Carlo Example | Part Tolerance Specification ▶ |