Running Monte Carlo
In this topic:
Overview
There are actually two types of Monte Carlo analyses. These are:
- Single step Monte Carlo sweep
- Multi step Monte Carlo run.
An example of 1. can be seen in the figure in Monte Carlo. This was a run where the gain at a single frequency was calculated 1000 times with the Monte Carlo tolerances applied. This used AC analysis with the Monte Carlo sweep mode - one of the six modes available. Only a single curve is created hence the name single step.
An example of 2 is the example at the beginning of this chapter. Here a complete frequency sweep from 1kHz to 100kHz was repeated 100 times creating 100 curves.
Setting up a Multi Step Monte Carlo Run
- Select schematic menu . Select the AC, DC, Noise, Transient or TF tab as required.
- Define the analysis as required.
-
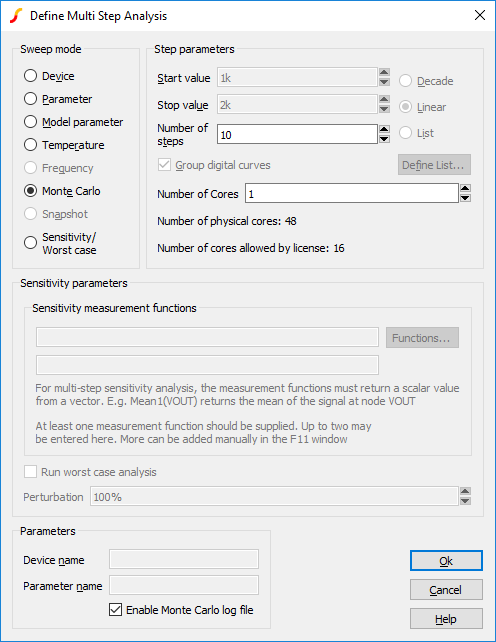
In the Monte Carlo and Multi-step Analysis section, check the Enable multi-step box then press the Define... button. This will open:-

- In the Sweep mode section, select Monte Carlo.
- In the Step Parameters section, enter the number of steps required.
- You can set the Number of Cores to a number large than 1 if your system and license permit it. This will substantially speed up the run. For more information see Using Multiple Cores for Multi-step Analyses.
Setting up a Single Step Monte Carlo Sweep
- Select schematic menu . Select the AC, DC, Noise or TF tab as required.
- In the Sweep Parameters section, press the Define... button.
- In the Sweep Mode section select Monte Carlo.
- In the Parameters section enter the required value for the Number of points.
- For AC, Noise and TF, you must also supply a value for Frequency.
Setting the Seed Value
The random variations are created using a pseudo random number sequence. The sequence can be seeded such that it always produces the same sequence of numbers for a given seed. In Monte Carlo analysis, the random number generator is seeded with a new value at the start of each run and this seed value is displayed in the log file.
Using the seed value you can repeat a run that perhaps produced unexpected results. Obtain the seed used for that run, then repeat with the seed value but doing just a single run. You will then be able to probe around the circuit and plot the results for just that run. The procedure to do this is as follows:
-
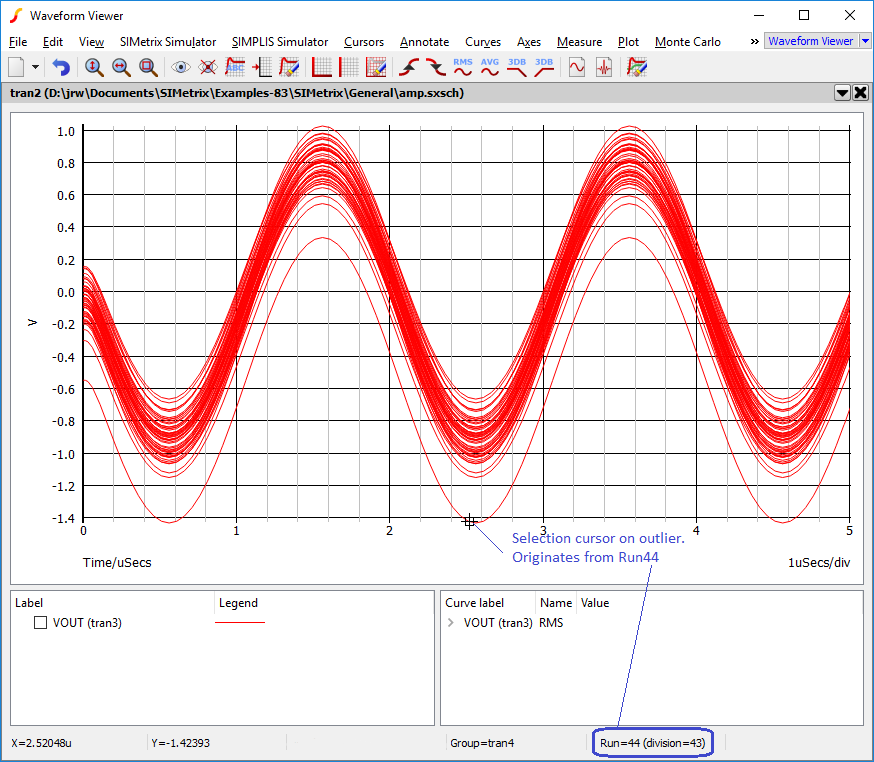
Identify the Monte Carlo step that you wish to repeat. The picture below shows how to obtain the Run number from a Monte Carlo plot.

- Open the Monte Carlo log report using menu . In the Seed Table locate the run number obtained in step 1. From this read the seed value.
- Select schematic menu .
- Select Options tab and enter the seed value in the Monte Carlo section.
The first run of each Monte Carlo analysis will use the same random values as the run from which you obtained the seed value in the log file. Note this assumes that only changes in values are made to the circuit. Any topology change will upset the sequence.
| ◄ Part Tolerance Specification | Running Sensitivity and Worst-case ▶ |