DVM Principles
In this topic, you will learn the basic principles of DVM and how to convert a working schematic to run in DVM. After converting your schematic to run in DVM, you will run a few tests out of a built-in testplan on your schematic. Finally an introduction to testplan syntax will be covered.
To download the examples for the Applications Module, click Applications_Examples.zip
In this topic:
Key Concepts
This topic addresses the following key concepts:
Schematic Prepared for DVM:
- To use DVM you need a schematic and a Testplan. Built-in testplans for common converters, such as a DC/DC converter with a single input and output are included in DVM.
- DVM uses special DC Input Sources, AC Line Input Sources, and Output Load symbols where the electrical subcircuit used in the simulation can be changed for each test in the testplan.
- The 3 and 4 pin output load subcircuits include the AC perturbation source for a Bode Plot analysis.
- DVM keeps track of these special source and load symbols with a system of Managed Sources and Loads, where the source and load reference designators are stored on the control symbol.
- When using symbolic values, the schematic stores the numerical values on the DVM Control Symbol and the testplan refers to those values using symbolic references.
Testplans:
- Testplans are nothing but tab-delimited ASCII text files which you edit in a spreadsheet program.
- Each row in a testplan is a test to be executed, each column defines an action for that test.
- Testplans can use Symbolic Values to represent the input voltage or output load levels, which greatly simplify the reuse between schematic designs.
- Objectives are predefined
test configurations which define:
- The source and load subcircuits.
- The analysis type, e.g. Transient, POP, AC.
- The post-simulation measurements to be make as well as any additional curves to create.
- Scalar measurements made by DVM can be selected on the DVM Control Symbol dialog.
What You Will Learn
In this topic, you will learn the following:
- How to configure a schematic for DVM.
- How to run tests from a built-in testplan on your schematic.
- The basics of testplan syntax.
Part I: Preparing the Schematic for DVM
At the very minimum, preparing a schematic for DVM requires you add a DVM control symbol. There are two types of DVM Control Symbols: basic and Full Power Assist. The basic control symbol enables a limited portion of DVM, and for the exercises in this topic, you will use the more flexible "Full Power Assist Control Symbol." The Full Power Assist Control Symbol allows you to store Symbolic Values for the input voltage range or full load current, which are required to run the built-in testplans.
- A Full Power Assist DVM Control Symbol.
- A DVM input source and an output load symbol.
- You enter the design specifications for the input voltage and output load into the DVM control symbol.
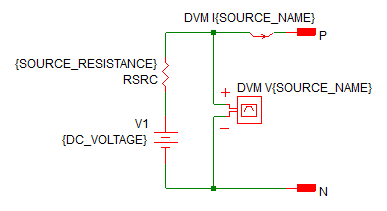
Exercise #1: Add an Input Source Symbol
To add the input source, follow these steps:
- Open the apps_d_0_llc_converter_efficiency.sxsch.
- Delete the DC voltage source VIN on the left side of the schematic.
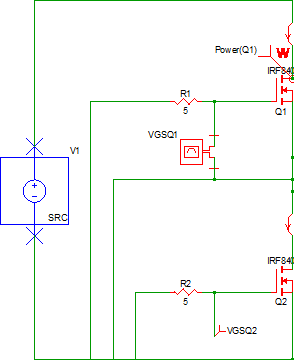
- From the parts selector, choose , and place the symbol where you removed the DC source VIN.
- Add and remove wires to connect the source as shown below:
Exercise #2: Add a 3-Terminal Output Load Symbol
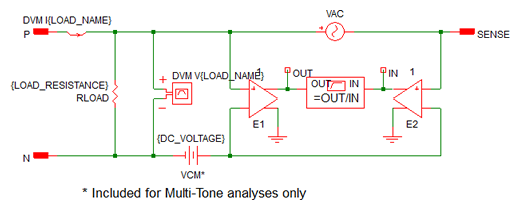
The 3 and 4-terminal DVM output loads have a SENSE (3-terminal) or a differential SENSE (4-terminal) connection. These extra pins allow DVM to include the injected AC perturbation source and Bode plot probe that are required for closed-loop AC analysis. DVM automatically inserts these components into the load subcircuit definition for the Bode plot tests. For this circuit you will use the 3-terminal output load.
To add the 3-terminal output load, follow these steps:
- Delete the RL resistor and VAC source from the right side of the schematic.
- From the parts selector, choose , and place it where you removed the load resistor RL. You will need
to mirror the symbol about the vertical axis using the F6 key before
placing the symbol.
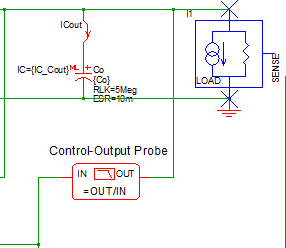
- Connect the SENSE terminal on the DVM 3-terminal output load to the
feedback network. Note: The SENSE terminal provides the output voltage feedback information to the converter control loop. During Bode plot tests, the small signal AC source is inserted between the positive load terminal and the SENSE terminal and perturbs the control loop. For all other test objectives, the SENSE terminal is shorted to the positive output terminal of the load. The schematic should appear as shown below:
Exercise #3: Add the DVM Control Symbol
To place a DVM control symbol, follow these steps:
- From the parts selector, choose .
- Place the symbol at the top of the schematic.
It is important to note that when you place the DVM Control Symbol after placing the source and load symbols, DVM performs a number of housekeeping tasks. These include:
- DVM detects the input source and output load symbol(s) and configures the DVM Control Symbol accordingly. DVM supports up to five input sources and six output loads. You can add loads or sources at any time.
- DVM automatically reads the analysis parameters from the F11 window and adds these parameters to the DVM Control Symbol.
Exercise #4: Enter Circuit Specifications
When you placed the DVM Control Symbol, the program detected the input source and output load symbols and configured the control symbol with one managed input source (V1) and one managed output load (I1). The program also read in the analysis directives you set in the dialog, these directives were copied onto the control symbol. Since the program has no way of knowing what the input and output voltages and load currents are, you need to change these parameters to suit this particular circuit.
To change the circuit specifications, follow these steps:
- Double click on the DVM control symbol. Result: The SIMetrix/SIMPLIS DVM Control Panel opens.
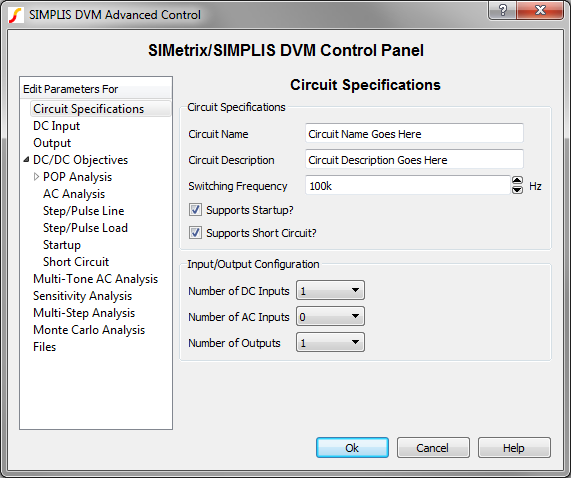
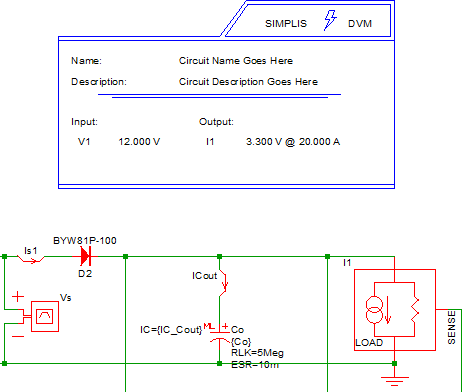
- On the Circuit Specifications page, set the values as listed in the following
table.
Parameter Value Units Circuit Name test_llc_converter Circuit Description LLC Converter Switching Frequency 85k Hz Note: Leave the default values for the other fields on this page. - Click on DC Input in the page-selection box on the left side of the
control panel, and then enter the values listed below.
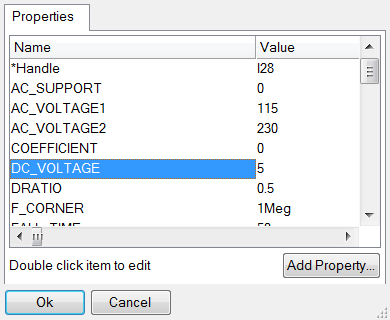
Parameter Value Units Voltage Nominal 380 V Minimum 360 V Maximum 400 V Misc. Source Resistance 0 Ohm - Click on Output in the page-selection box, and enter the values listed
below.
Parameter Value Units Voltage Nominal 24 V Tolerances Peak to Peak 120 mV Current Maximum 5 A Light Load @ Vin Min 0.5 A @ Vin Max 0.5 A Note: Leave the default values for the other fields on this page. - Click on the POP Analysis entry to bring up the POP page.
- Verify that Use "Pop Trigger" schematic device is checked.
- Click Ok to save the specification changes.
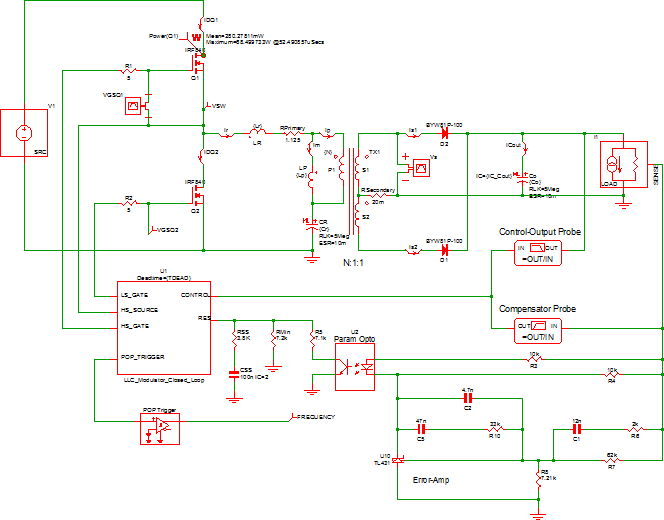
- Save the schematic as test_llc_converter.sxsch.Result: At this point, the schematic is configured to run the built-in testplans which use symbolic values and the DVM source and load subcircuits. A per-prepared schematic at this state is included in the zip archive with file name: apps_d_1_llc_converter_efficiency.sxsch.
Part II: Run a Built-in Testplan
Now that you have prepared the schematic for DVM, you can run a built-in testplan on it. In the next exercise, you will run a Bode Plot test from the built-in testplan at nominal input voltage and 100% load.
Exercise #5: Run a Bode Plot Test
- Open the test_llc_converter.sxsch schematic you created in Exercise #4, or the apps_d_1_llc_converter_efficiency.sxsch schematic from the zip archive, if you didn't complete the previous exercise.
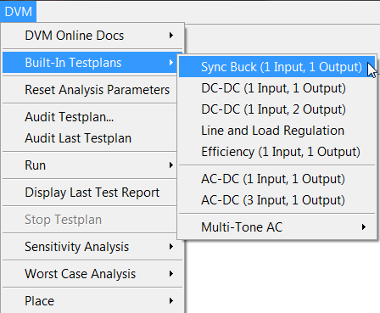
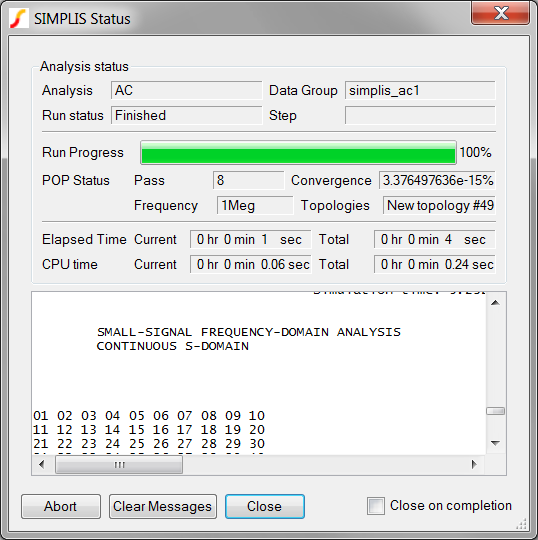
- Run the built-in DC/DC 1 Input/1 Output testplan using the menu: Result: A test selection dialog appears as follows:
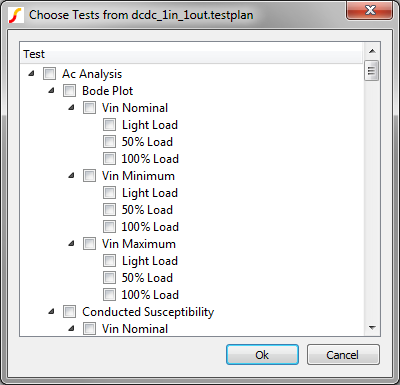
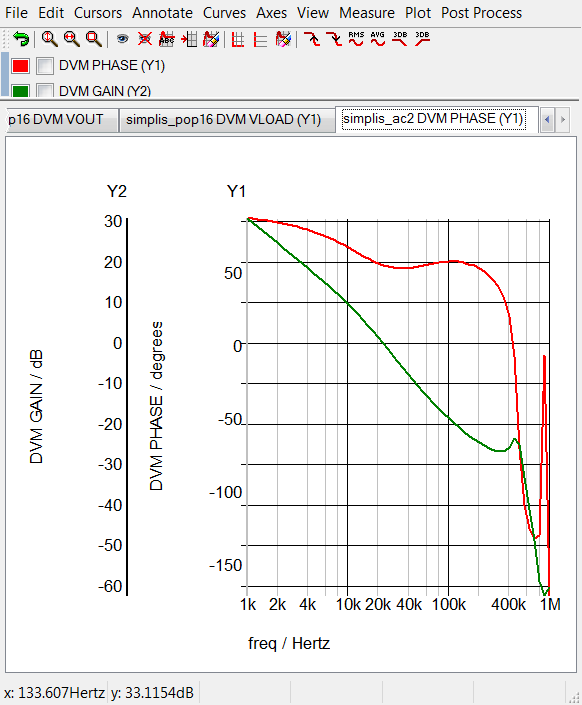
- Select the third test - AC Analysis > Bode Plot > Vin Nominal > 100%
Load
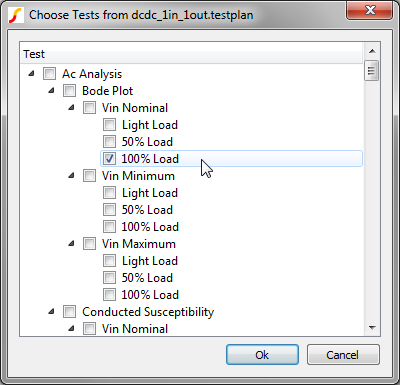
- Click OkResult: DVM configures the schematic for a Bode Plot test, which includes:
- Setting a POP and AC analysis for the simulation run.
- Configuring the input source to be a DC source.
- Configuring the output load to be a Bode Plot type load which includes loop perturbation and a Bode Plot probe.
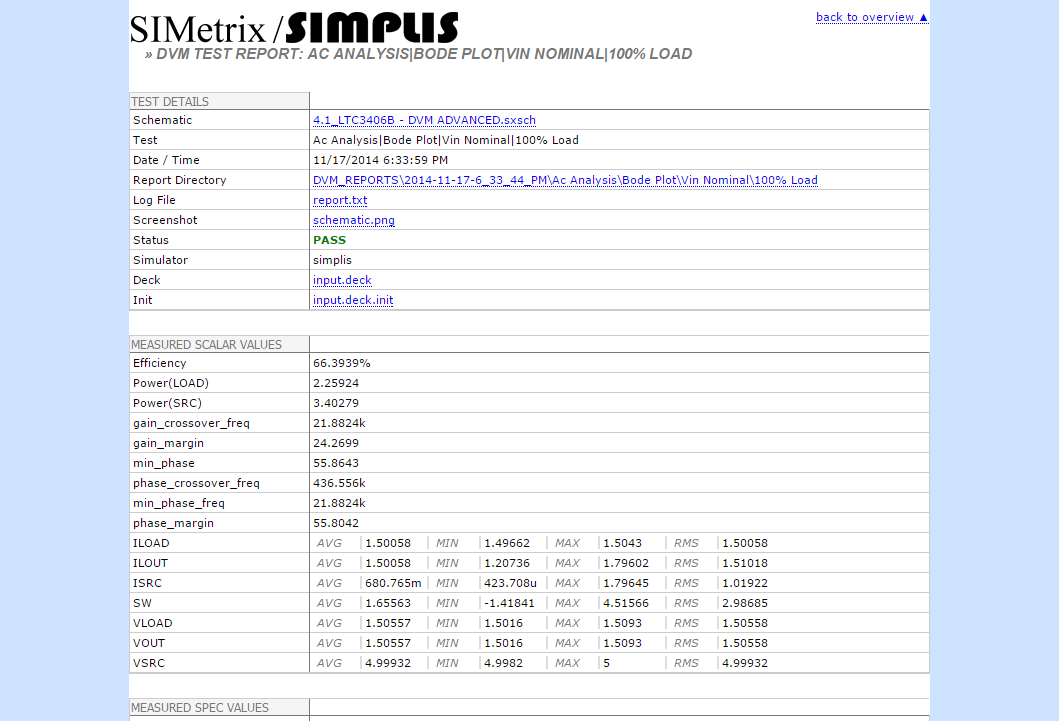
- Applying the measurements to the input source and output load. The load measurements include gain crossover frequency, gain margin and phase margin.
This simple exercise demonstrates the steps DVM makes to setup the schematic for simulation, simulate the design, and gather the results. Of course, you could have selected multiple tests and DVM would process the tests in order, taking the same steps for each test you selected. The actions performed for a test are defined in the testplan row for the test, and in the next part, you will learn the testplan format for this test.
Part III: All About Testplans
In the Key Concepts section you learned that to run DVM, you need a prepared schematic and a testplan to run on that schematic. In Part I you prepared your schematic for DVM, and in Part II you ran a test without really looking into what is inside the testplan. In this section, you will learn about testplan syntax, and how to edit testplans.
Exercise #6: View Built-in Testplan
In the previous exercise, you ran a single test out of the DC/DC (1-input, 1-output) testplan. When you ran that testplan, a copy of the testplan was made and saved to your schematic's working directory. You can now use this copy as a template or a starting point for defining custom tests. To open this copy in Microsoft Excel,
- Open Microsoft Excel.
- On the test_llc_converter_efficiency.sxsch schematic, right click on the
gray title bar where the filename is displayed in bold.Result: The following context menu is displayed:
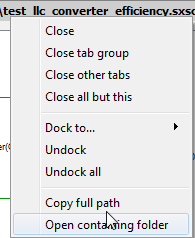
- Select the Open containing folder menu item.Result: A Windows Explorer window opens in the schematic's directory, Applications_Examples.
- In the Windows Explorer window, scroll down to the dvm_builtin-dcdc_1in_1out.testplan file.
- Drag and drop this file into Excel.
- You may be presented with an import wizard dialog. If so, select tab delimited and click Ok on the other import dialog pages.
- Blank lines are ignored.
- Lines starting with an asterisk (*) are considered comments and are ignored.
- Inline comments are not supported; that is, you can comment out an entire line, but not a portion of a line.
- Each non-blank, non-comment line in the testplan describes a set of test conditions for a single test. Each column performs some action during the test.
- The testplan can have a header row. The first entry on the header row starts with *?@. The program reads the file and identified the header row by looking for this special three character sequence.
- Any column can have an empty cell in a row but the behavior is different for columns
with function headings.
- If the column heading is a function, such as Var(vout , 1.2), DVM uses the default value, in this case 1.2.
- If the column heading is not a function, DVM makes no changes for that column where a cell is empty.
The header row for this testplan is on row #4, and the Bode Plot test with the input voltage at the Nominal value and the load set to 100% is on row #8.
| 1 | *** | |||||
|---|---|---|---|---|---|---|
| 2 | *** dcdc_1in_1out.testplan | |||||
| 3 | *** | |||||
| 4 | *?@ Analysis | Objective | Source | Load | Label | |
| 5 | *** | |||||
| 6 | Ac | BodePlot(OUTPUT:1) | Source(INPUT:1, Nominal) | Load(OUTPUT:1, Light) | Ac|Bode Plot|Vin Nominal|Light Load | |
| 7 | Ac | BodePlot(OUTPUT:1) | Source(INPUT:1, Nominal) | Load(OUTPUT:1, 50%) | Ac|Bode Plot|Vin Nominal|50% Load | |
| 8 | Ac | BodePlot(OUTPUT:1) | Source(INPUT:1, Nominal) | Load(OUTPUT:1, 100%) | Ac|Bode Plot|Vin Nominal|100% Load | |
| 9 | *** | |||||
Let's examine the testplan row by row and then column by column. The first three rows are comments and are completely optional.
Comment Rows
| 1 | *** | |
| 2 | *** dcdc_1in_1out.testplan | |
| 3 | *** |
As long as the first character in the line is a *, you may change the text in these line without affecting DVM operation.
The Header Row
The next row is the extremely important header row. The header row tells the program what type of entries to expect in fields for the following rows. It is assumed that all electrical tests are entered below the header row. Here is the header row and we will examine this in more detail:
| 4 | *?@ analysis | objective | source | load | label |
- The first entry:
*?@ analysis
The Analysis column allows you to either explicitly set a simulation analysis (.POP. .TRAN, etc) or in this case the Ac placeholder is used. This column is not strictly needed for the built-in testplans. - The second entry:
objective
tells the program to expect one of the predefined test objectives. In this example, a BodePlot() Test Objective which measures the loop response of the circuit. - The third entry:
source
can be used to modify subcircuit type used for a source, or to set the amplitude of a source. - The fourth entry:
load
like the source column, you can change the subcircuit type for a load or change the load value with this column. - The fifth column is the test Label. The label is electrically inactive and is used to populate the test selection dialog.
A couple of comments are in order and some conclusions can be made from this testplan header row.
The Vin Nominal, 100% Load Bode Plot Test
Now that you know the purpose of the header row, you will learn what actions are performed for each field entry for the test you just ran, the nominal input voltage, 100% load Bode Plot test. In the table below, the header row and the Bode Plot test row are duplicated for clarity.
| 4 | *?@ Analysis | Objective | Source | Load | Label | |
|---|---|---|---|---|---|---|
| 8 | Ac | BodePlot(OUTPUT:1) | Source(INPUT:1, Nominal) | Load(OUTPUT:1, 100%) | Ac|Bode Plot|Vin Nominal|100% Load |
- The first entry:
Ac
is a placeholder, and tells DVM to expect a valid AC test ojective in a following Objective entry. - The second entry:
BodePlot(OUTPUT:1)
tells the program to run a Bode Plot test on the symbolic reference designator OUTPUT:1. This actual reference designator (I1) is stored on the DVM control symbol. OUTPUT:1 literally means "Find the first output load reference designator on the DVM Control Symbol and substitute that reference designator here." The test objective does most of the work for this test. The BodePlot() Test Objective performs these actions:- Sets up a POP and AC analysis for the circuit. The simulation parameter values are taken from the DVM Control Symbol.
- Configures the input source to be a DC Input Source.
- Configures the output load to be a Bode Plot Load - Resistive Load, and this load contains the AC perturbation source and Bode Plot probe.
- Sets up the measurements for the Bode Plot test, you elect which measurements to make on the input sources, output loads, and the AC Bode Plot curves in the DVM Measurements dialogs. These measurements are stored on the DVM Control Symbol.
- Finally, the BodePlot() test objective sets the specification checking for the test. For the Bode Plot test, there are two specifications - Gain Margin, and Phase Margin. You define both specification values on the DVM Control Symbol.
- The third entry:
Source(INPUT:1, Nominal)
uses the INPUT:1 symbolic reference designator, and this entry does only one thing: it changes the amplitude of the first managed source. The symbolic value Nominal is read from the DVM Control Symbol. It should be noted that the Source() Function doesn't change the subcircuit type - that was changed by the test objective in a previous column. - The fourth entry:
Load(OUTPUT:1, 100%)
like the source column, this entry changes the load current, in this case, the Load function changes the value of the load to 100% of the full nominal load current. You set the full load current on the DVM Control Symbol for each output. - The fifth entry:
Ac|Bode Plot|Vin Nominal|100% Load
defines how the test will be displayed in the test selection dialog. The pipe(|) characters define levels of hierarchy in the test selection dialog:
In this section you learned how the header row works in combination with a row which defines a single test. In the next section, an animated slideshow describes the test actions on a column-by-column basis for this particular test.
DVM Slideshow
The following slideshow illustrates the sequence of actions that DVM takes as it executes a single test from the Built-In Sync Buck testplan. The test used for this example is the same BodePlot test described in the previous section.
- You can pause the slideshow by moving the mouse cursor over the images.
- To go forward or back one slide, click the arrow links that appear when you mouse over the slideshow.
- Each slide number is shown in the bottom right-hand corner. You can jump to a particular slide by clicking one of the gray squares at the bottom on the image. The current slide is indicated by the white square.
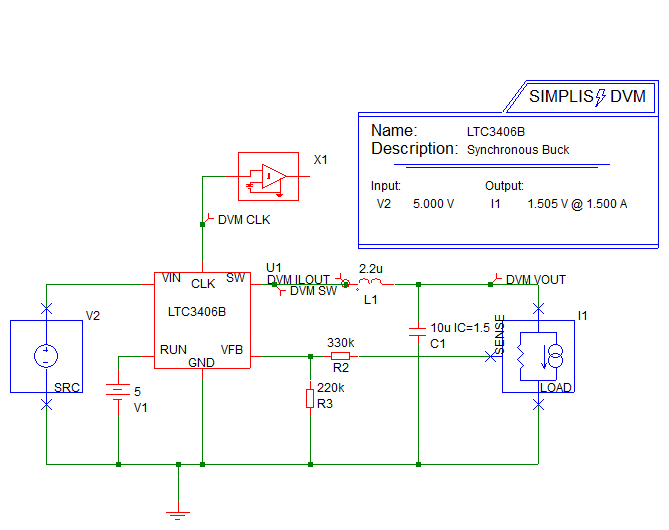
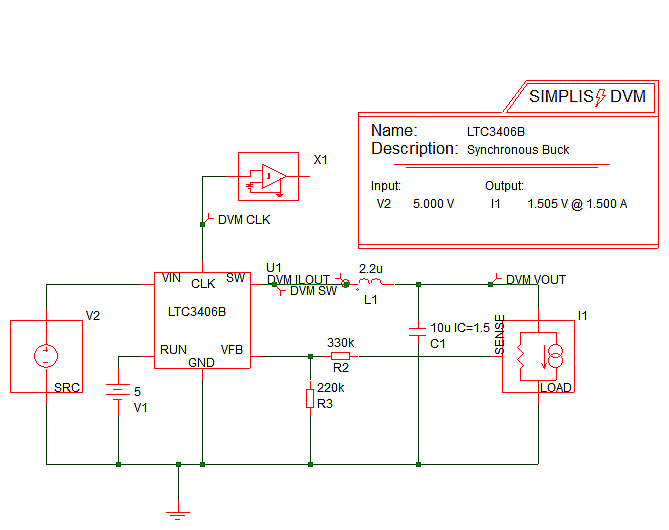

Although the slideshow illustrates actions that DVM takes for a single test from the built-in testplan, the DVM functionality encompasses much more than just Bode plot testing. Built-in testplans for one-input, one-output and one-input, two-output DC/DC converters are provided and include a full suite of tests that designers often run on power supplies, including Step Line, Step Load, Input and Output Impedance, and more.
Additionally a full suite of AC/DC tests are available in the one-input, one-output and thee-input, one-output Built-In AC/DC testplans.
For a full list of available tests, see the the following topics:
DVM also provides the ability to customize testplans to suit any design. For details about how to customize test plans, see Customizing Testplans in the DVM Tutorial.
Part IV: Symbolic Values
Note a very interesting fact about the DVM slideshow versus the LLC example you prepared for and ran in DVM. The testplan is identical for both converters, yet the converter in the slideshow has a 5V nominal input voltage while the LLC converter has a 380V nominal input voltage. This is one place where the symbolic values for the input voltage sources and the output loads really shines. By storing these specification values on the DVM Control Symbol, instead of in the testplan, a single testplan can be used for both converters.
In the next topic : Generating Efficiency Plots with Multi-Step Runs in DVM, you will explore a few other testplan entries and see how small changes to a testplan yield dramatic results.
Conclusions and Key Points to Remember
- Using DVM requires a schematic prepared for DVM, and a testplan defining the tests to be run.
- DVM can use symbolic values which are stored on the DVM control symbol.
- Testplans are simple tab delimited text files which you edit with a spreadsheet program.
- The header row defines the allowed entries in each test row - that is, the allowed column entries are defined by the header row entry for that column.