3.2 Set up a POP Analysis
In this section, you will set up a SIMPLIS Periodic Operating Point (POP) analysis which finds the steady-state operating point of the converter.
In this topic:
Key Concepts
This topic addresses the following key concepts:
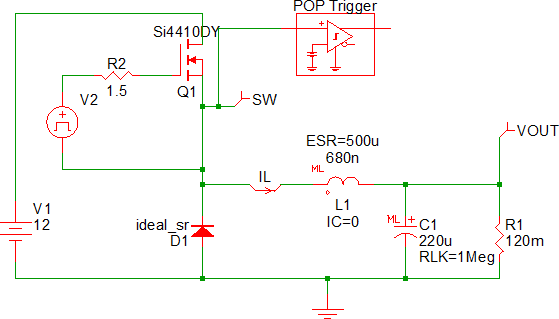
- In order for the POP analysis to find the steady-state operating point it needs to know which node on the schematic represents the lowest periodic frequency. You identify the lowest periodic frequency node with a special SIMPLIS symbol, the POP Trigger Schematic Device.
- The POP trigger model is unique to SIMPLIS and contains a reference voltage and comparator.
- The POP trigger device tells SIMPLIS which node to use to detect the beginning of each new POP period during the Periodic Operating Point analysis.
- This schematic node should trigger the POP trigger to switch at the lowest frequency at which the entire system is periodic; in other words, the lowest frequency at which every energy-storage element in the system exhibits periodic behavior. For this converter, any voltage which switches at the 500kHz switching frequency can be used for the POP Trigger input.
What You Will Learn
In this topic, you will learn the following:
- How to add a POP trigger to the schematic
3.2.1 Add a POP Trigger to the Schematic
To add a POP trigger, follow these steps:
- Open the schematic that you saved after running the transient simulation
or
open 3_SIMPLIS_tutorial_buck_converter.sxsch. - From the Part Selector, double click on the Commonly Used Parts category to expand the list.
- In the expanded list, double click Pop Trigger Schematic Device.
- Place the cross hair directly above the inductor, and click the left mouse button to
place the POP trigger. Note: If you need to move the POP Trigger symbol after you place it, press and hold the left mouse button on the symbol and then drag the symbol lower on the schematic.
- Make sure that the trigger is deselected, and place the cursor at the end of the
line on the left side of the POP trigger.Result: The cursor changes from a cross hair to a pencil.
- Click the left mouse button, and draw a short horizontal line to the left.
- Click the left mouse button again to create a corner, and extend the wire to the line that connects to the voltage probe for the switching node.
- Click the left mouse button again to make the connection and then click the right
mouse button to finish the wire.Result: The schematic should now look like this:
- To save this version of the schematic, select from the menu bar in the schematic editor.
3.2.2 Set up the POP Analysis
To set up the POP analysis directives, follow these steps:
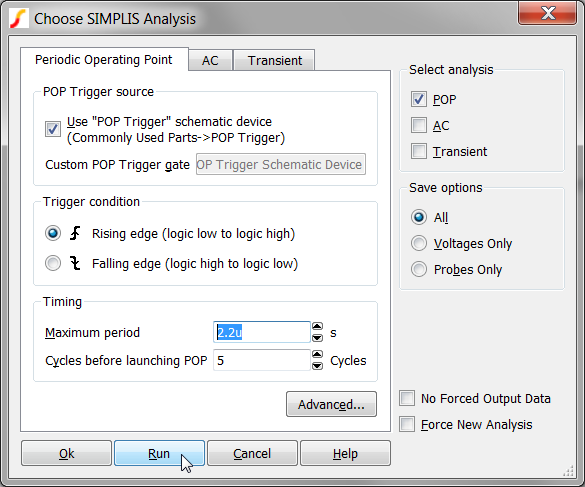
- From the menu bar in the Schematic editor, select Result: The Choose SIMPLIS Analysis dialog opens.
- Click the Periodic Operating Point tab.
- In the Select analysis section on the upper right side of the dialog box, check POP and uncheck Transient.
- To specify the maximum switching period for your circuit, go to the Timing
section of the dialog and change the Maximum period value to 2.2μs.
Note: This Maximum period value is 110% of your steady-state period. The maximum period parameter limits the solution space in which POP searches for a steady state condition. The maximum period parameter must be greater than the switching period but it is recommended that it not be set to more than two times the switching period.
- After you enter the analysis directive parameters, do one of the following:
- Click the Run button.
or
- Click Ok to save the data and press F9 to run the simulation.
Result: The waveform viewer window opens with the steady-state waveforms for your converter.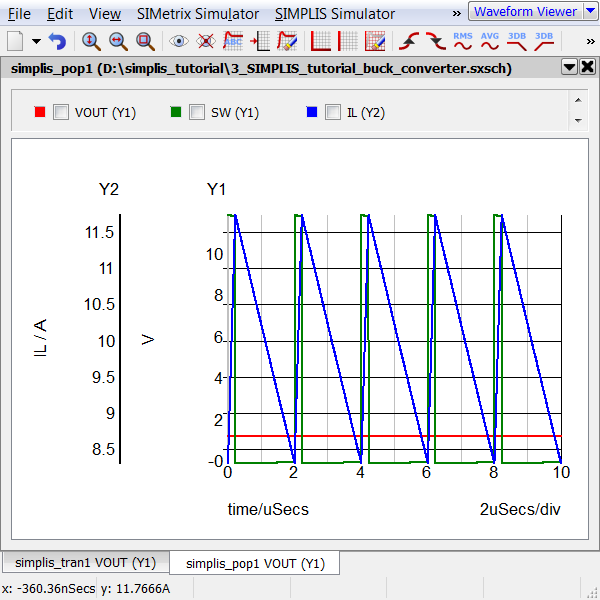
- Click the Run button.
In the window shown above, the probed waveforms for VOUT, SW, and IL are displayed for five periodic switching cycles. Notice that the converter displays no settling behavior and the waveforms are in perfect steady-state. The POP algorithm can save enormous amounts of elapsed time by accelerating the simulation to the correct steady-state operating point.
3.2.3 Save your Schematic
To save your schematic, follow these steps:
- Select .
- Navigate to your working directory where you are saving your schematics.
- Name the file 4_my_buck_converter.sxsch.
A schematic saved at this state can be downloaded here: 4_SIMPLIS_tutorial_buck_converter.sxsch.