Bode Plot Probe w/ Measurements
The Bode Plot Probe w/ Measurements generates plots for the gain and phase of the ratio of two voltages. The probe cab be configured to plot only the gain or phase, or both gain and phase.
In this topic:
| Model Name: | Bode Plot Probe | |
| Simulator: |
|
This device is compatible with both SIMetrix and SIMPLIS simulators |
| Schematic Menu Location: | ||
| Parts Selector Menu Location: | ||
| Symbol Library: | Connections | |
| Model File: | none | |
| Symbol: |
|
|
| Multiple Selections: | If multiple Bode plot probes are selected before editing, all properties except the curve labels can be simultaneously changed for all probes. The curve label properties will remain unchanged for all selected probes. | |
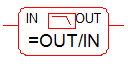
| Usage: | This schematic probe symbol plots the magnitude and phase of the ratio of two complex voltages, OUT/IN. The magnitude can be plotted in db or volts/volts; the horizontal axis scale is determined by the simulation sweep type. If the simulation is swept in log frequency steps, the horizontal axis will automatically be log scaled. | |
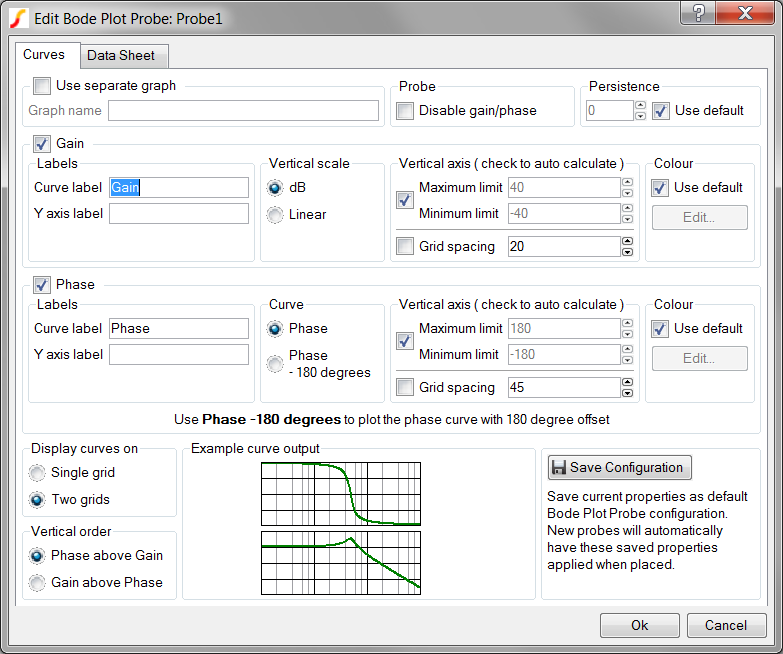
Editing the Bode Plot Probe w/ Measurements
To configure the Bode Plot Probe w/ Measurements, follow these steps:
- Double click the symbol on the schematic to open the editing dialog to the Parameters tab.
- Make the appropriate changes to the fields described in the table below the image.
| Label | Description |
| Use separate graph | Check this option in order to supply an alias for each output graph tab. |
| Graph name | The Graph name is an alias for each output graph tab and will not be visible on the graph output. Curves with the same graph name property will be output on the same graph tab. Graph name be safely ignored unless multiple Bode plot probes are used. Use separate graph must be checked to supply this name. |
| Disable gain/phase | Check this box to disable both gain and phase graphs |
| Persistence | The
Persistence property determines when previous simulation data is deleted
from the graph viewer. If Use default is checked or if the persistence is
set to -1, the probe uses the default global persistence value. The default persistence can be set from the command shell menu: .
|
| Curve label | Sets the
name of the curve. Note: This field appears in both the Gain and Phase
groups on the dialog.
|
| Y axis label | Sets the Y
axis label for the individual gain and phase axes. When multiple curves from
multiple probes are placed on the same axis, the axis label properties must
be identical or the axis label is blank. If this field is left blank, the
axis label appears with the name specified in the Curve label field. Note:
This field appears in both the Gain and Phase groups on the
dialog.
|
| Vertical scale | Allows you
to select the function to perform on the simulation data.
|
| Curve | Selects the
Phase curve offset
|
| Vertical axis | This group
has two options:
Vertical limits:
Both minimum and maximum axis limits must be set or auto-calculated as a group.
Grid spacing:
Note: This field appears in both the Gain and Phase groups on
the dialog.
|
| Colour | Defines
colors for the curves:
The change the default sequence of colours from the command shell menu, select For additional information, see Colours and Fonts. Note: This field appears in both the
Gain and Phase groups on the dialog.
|
| Display curves on | Allows you to define the number of grids in the output: Single grid or Two grids. |
| Vertical order | Allows you
to specify the order of the curves: Phase above Gain or Gain above
Phase.
|
| Example curve output: |
Example curve output illustrates the relative locations of the two
curves. Note: The curve data here is
fixed; these curves are examples and do not reflect
the simulated curves.
|
| Save Configuration | Click Save Configuration to preserve this information as the default configuration for all future new Bode plot probes. |
Symbol Migration
Symbols placed on schematics in previous versions of SIMetrix/SIMPLIS can be automatically migrated to use the new symbols. The schematic tools menu will invoke a routine which migrates the existing symbols to the new symbols. As this action makes substantial changes to the schematic, it is recommended that you save a backup copy of the schematic first.