Elements of the Graph Window
In this topic:
Main Window

Windows and Tabbed Sheets
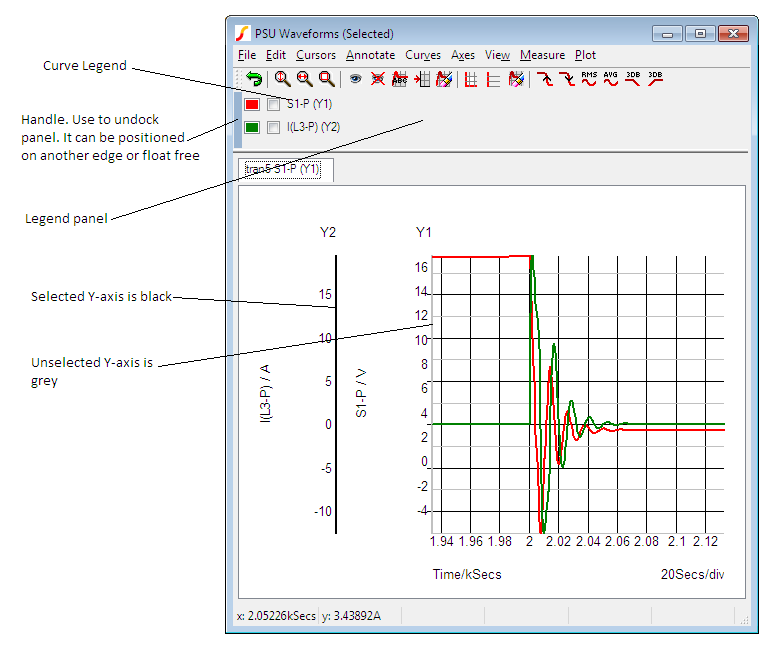
Normally new graphs are created within the same window as a tabbed sheet. A row of tabs will appear at the top of the graph window allowing you select which graph you wish to view. You can also create a new graph window using the menu . This will create an empty window to which you may add new graphs.
Graph Toolbar

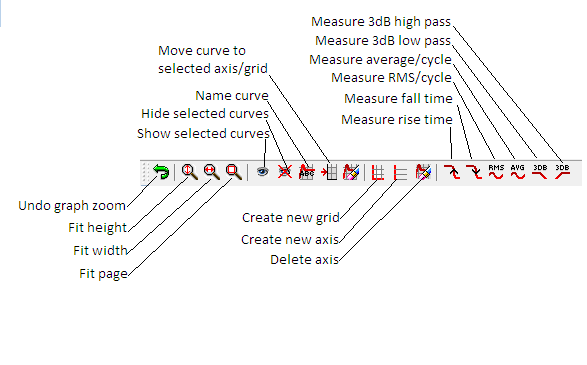
The above shows the function of each of the buttons on the graph toolbar. These are referred to in the following sections.
| ◄ Graphs, Probes and Data Analysis | Probes: Fixed vs. Random ▶ |