1.0.1 SIMPLIS is a Time-Domain Simulator, all the Time, for Every Analysis, Period
SIMPLIS is a time-domain simulator optimized for switching power converters. Most users come to SIMPLIS with some experience using SPICE simulators, which work on an entirely different set of principles. This topic introduces an important difference between SIMPLIS and SPICE. SIMPLIS is exclusively a time-domain simulator, even though it can present its time-domain results very accurately in frequency-domain plots.
In this topic:
Key Concepts
This topic addresses the following key concepts:
- The SIMPLIS simulator is a time-domain simulator which uses Piecewise Linear (PWL) models.
- The AC Analysis requires a periodic operating point (POP) analysis to be run first to find the switching steady-state operating point.
- The Transient analysis run after a POP analysis is initialized to the POP steady-state operating point.
What You Will Learn
In this topic, you will learn the following:
How SIMPLIS analyzes circuits exclusively in the time domain. This includes the SIMPLIS AC analysis, which is carried out in the time domain.
Getting Started: Running SIMPLIS
In this exercise, you will simulate a synchronous buck converter in the each of the three SIMPLIS analyses, Periodic Operating Point, AC analysis and Transient Analysis.
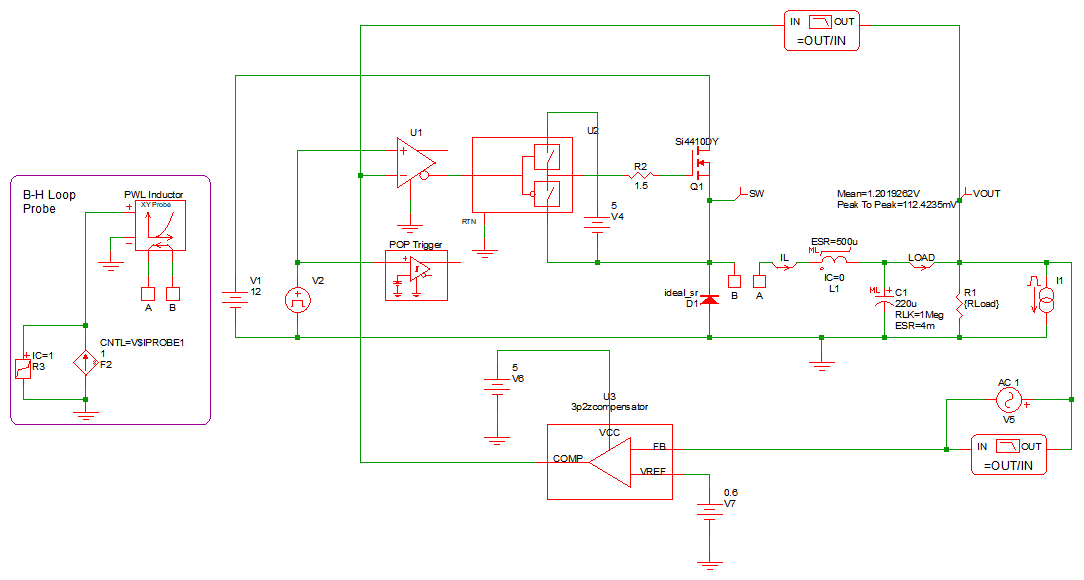
- Open the schematic titled 1.2_SIMPLIS_tutorial_buck_converter.sxsch.Result: The buck converter schematic opens:
-
To simulate the design, press F9 or from the menu bar,
select .Result:
- The SIMPLIS simulator simulates the same time-domain nonlinear schematic in each of the three analysis modes, Periodic Operating Point (POP), AC, and Transient.
- The SIMPLIS Status window opens when the simulation is first launched, and the waveform viewer displays the simulation results as the simulation progresses.
- The results from the POP analysis are not displayed, as the transient analysis was specified. The transient simulation begins at the operating point found by the POP analysis and only the transient analysis results are displayed.
- The simulation results displayed in the waveform viewer include waveforms plotted versus time as well as time-domain waveforms that are plotted against each other using X-Y plots, where time in an implicit variable.
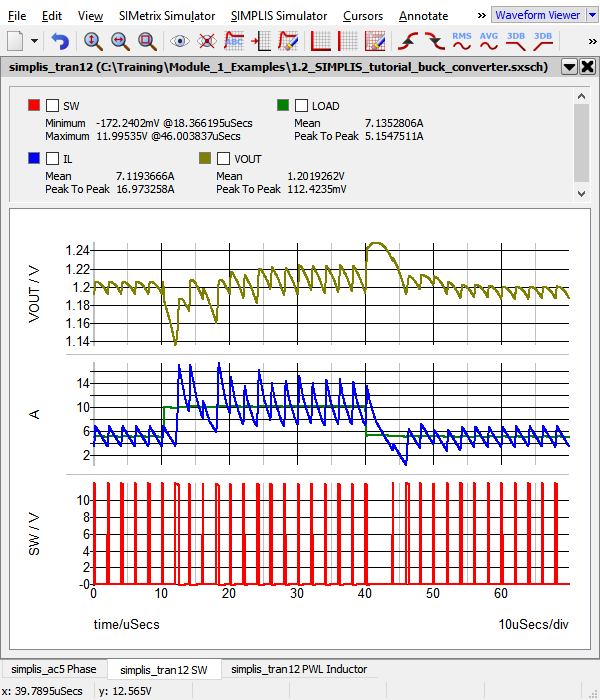
After running the simulation, the waveform viewer contains a number of graphs. The left-most tab has the gain and phase of the converter control loop taken from the AC Analysis. The other tabs have the results of the transient analysis.
Discussion
SIMPLIS runs these three analyses in the following order:
- Periodic Operating Point (POP) Analysis
- AC Analysis
- Transient Analysis
- Perform a small signal AC analysis on the circuit at this steady-state operating point.
- Initialize the circuit for the following transient analysis.
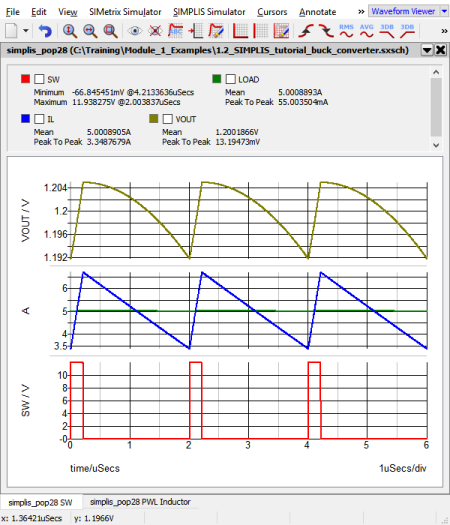
Each of these analyses are executed in the time domain, which is exactly what happens on the lab bench. The Periodic Operating Point analysis is discussed in detail in section 1.0.5 POP Analysis, for now think of the POP analysis as a way to accelerate the process of getting to steady state. A key point to remember is that without the Periodic Operating Point, you cannot run an AC analysis on the circuit.
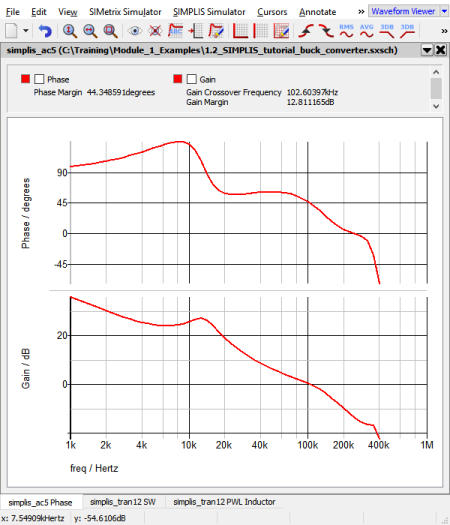
The AC analysis is carried out on the time domain model by first finding the Periodic Operating Point, then injecting a single time-domain sinusoidal perturbation signal into the circuit. The AC results are then calculated from the time domain response to the perturbation signal. Then the injected signal is stepped to the next frequency to be analyzed and the measurement process is repeated until the entire requested frequency range is covered. No averaged model is used. All AC analysis results are derived from the time-domain response of the full nonlinear system.
The time domain POP waveforms and the frequency-domain loop response of the Synchronous Buck Converter are shown below. The frequency response of the circuit is valid at the steady-state condition found during the POP analysis.
| Time Domain Waveforms | Frequency Response of Time Domain Model |
|
|
The transient analysis is similar to a transient analysis in other simulators, except it typically runs much faster.
Conclusions and Key Points to Remember
SIMPLIS operates just like your circuit in the laboratory - in the time domain.
- Your power electronic switching system in the lab has no concept of a DC operating point or an AC small signal model.
- The power switches turn ON and then OFF as determined by a modulator control circuit that senses the output and tries to regulate the circuit performance accordingly.
- If the circuit is not switching, it is not working correctly.
- A switching converter has no DC operating point.
- An averaged AC model is a theoretical construct, it does not exist on the lab bench.
- If you cannot successfully perform a POP analysis on your circuit:
- You cannot easily evaluate the AC performance of the circuit. (Caveat: DVM has a Multi-Tone AC analysis, but this takes much longer than the combination of a POP and AC analysis.)
- In the vast majority of cases, your simulations will take much longer, since you will have to first wait for the converter to reach steady state before you can perform your intended analysis.