Application D - Using the Design Verification Module
In section 1.1 Introduction to DVM: What is DVM? you learned the very basics of the DVM module. In that topic, you ran a number of tests from the built-in testplan. In this topic you will learn how to prepare a schematic for DVM and learn that DVM is capable of far more than the built-in testplan presented in the introduction topic.
This module presents DVM from a new perspecitve - instead of presenting DVM from the program's point of view, the perspective of an experienced SIMPLIS user who has a simulation problem to solve is used. As you will learn, DVM enables an experienced user to solve many problems which cannot be solved by a conventional single-step or multi-step simulation.
To download the examples for the Applications Module, click Applications_Examples.zip
In this topic:
Key Concepts
DVM can help you solve many problems including:
- Measuring the efficiency of a power converter over a wide range of line and load conditions.
- "Design of Experiments" - that is, characterization of a particular performance characteristic over line, load, or component variation.
- Sensitivity and Worst-Case Analysis. Sensitivity and worst case analysis are built-into DVM.
- Multi-Tone AC Analysis. Several types of converters are not compatible with the POP analysis, and therefore the AC response must use the large signal Multi-Tone AC Analysis.
- Characterization of a converter's response to repeated load transients with different pulse frequency and duty cycle. This example is used to characterize the minimum and maximum output voltage for VR controllers powering Intel CPUs.
What You Will Learn
The scope of problems DVM can help you solve is wide ranging and limited to your imagination.
In this topic, you will learn the following:
- That DVM can generate efficiency plots using nested multi-step runs.
- You can step a critical design parameter while generating efficiency plots to determine the optimum value of the design parameter. For example, the deadtime for a synchronous buck converter can be stepped while observing the change in converter efficiency.
- DVM can perform Design of Experiments (DOE) on a power converter - in this example, the loop characteristics are measured over line and load variation.
- Sensitivity and Worst Case analyses are built-into DVM.
- DVM has a powerful Multi-Tone AC analysis mode which can measure the small signal response of almost any circuit. The circuit doesn't have to be compatible with the Periodic Operating Point analysis to use the Multi-Tone AC Analysis.
- An rather complicated DOE is the simulation of a power converter's transient response when subjected to a repeating pulsed load.
DVM Slideshow
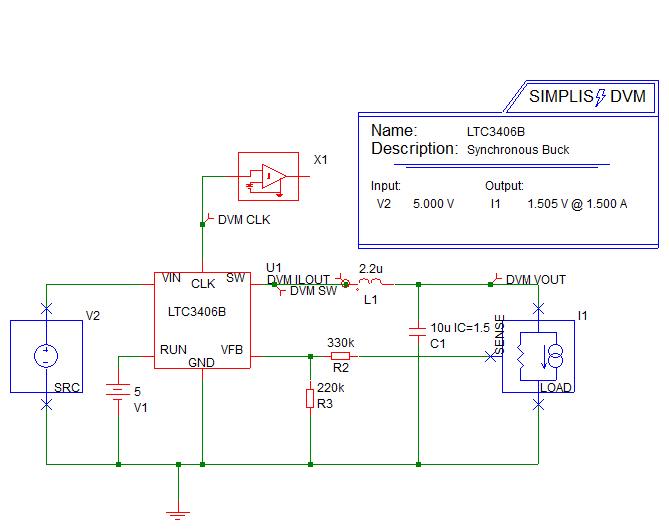
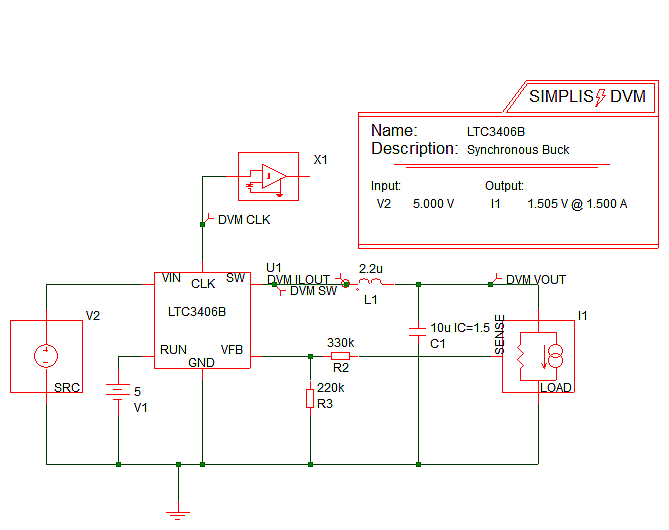
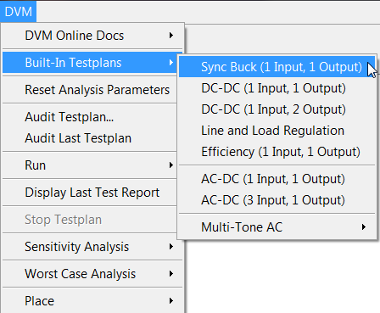
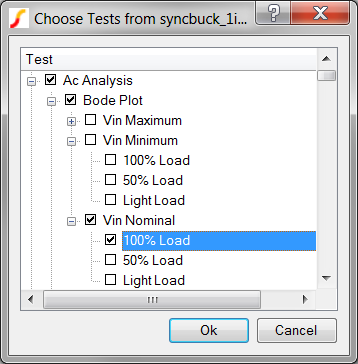
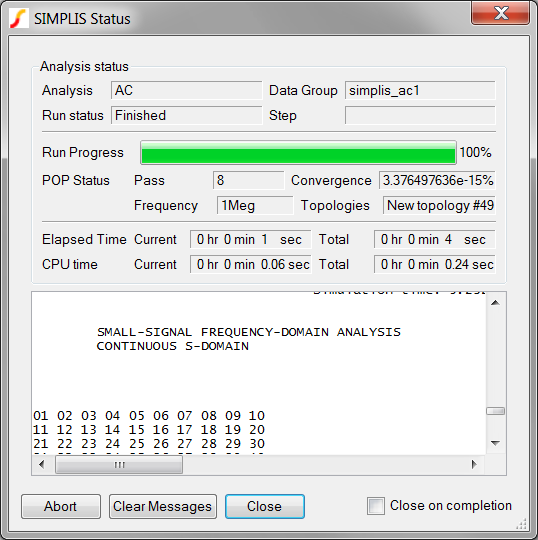
The following slideshow illustrates the sequence of actions that DVM takes as it executes a single test from the Built-In Sync Buck testplan. The test used for this example is the same BodePlot test described in the previous section.
- You can pause the slideshow by moving the mouse cursor over the images.
- To go forward or back one slide, click the arrow links that appear when you mouse over the slideshow.
- Each slide number is shown in the bottom right-hand corner. You can jump to a particular slide by clicking one of the gray squares at the bottom on the image. The current slide is indicated by the white square.
Although the slideshow illustrates actions that DVM takes for a single test from the built-in testplan, the DVM functionality encompasses much more than just Bode plot testing. Built-in testplans for one-input, one-output and one-input, two-output DC/DC converters are provided and include a full suite of tests that designers often run on power supplies, including Step Line, Step Load, Input and Output Impedance, and more.
Additionally a full suite of AC/DC tests are available in the one-input, one-output and thee-input, one-output Built-In AC/DC testplans.
For a full list of available tests, see the the following topics:
DVM also provides the ability to customize testplans to suit any design. For details about how to customize test plans, see Customizing Testplans in the DVM Tutorial.
Problems which DVM can Solve
Looking at real and tangible examples is the simplest way to understand what DVM is, and what it can do. Here are five examples.
Generating Efficiency Plots with Multi-Step Runs in DVM
- The power converter must be in absolute steady-state. If, for example, the converter is settling from a transient condition where the output voltage is slightly higher than the input voltage, the output power is not being supplied by the source and the measured efficiency can be greater than 100%. It is surprising how the smallest settling behavior can effect the efficiency measurement.
- The efficiency is calculated from the time-domain simulation data which often has fast edges. As the efficiency measurement involves the average input and output power, the time-domain simulation data must have sufficient points to accurately integrate the curves to produce a valid average value. A good reference is the applications topic : Application B - Switching Losses and Measuring Efficiency.
- Once the two previous requirements are met, one must run several simulations to produce a curve such as the one shown below:
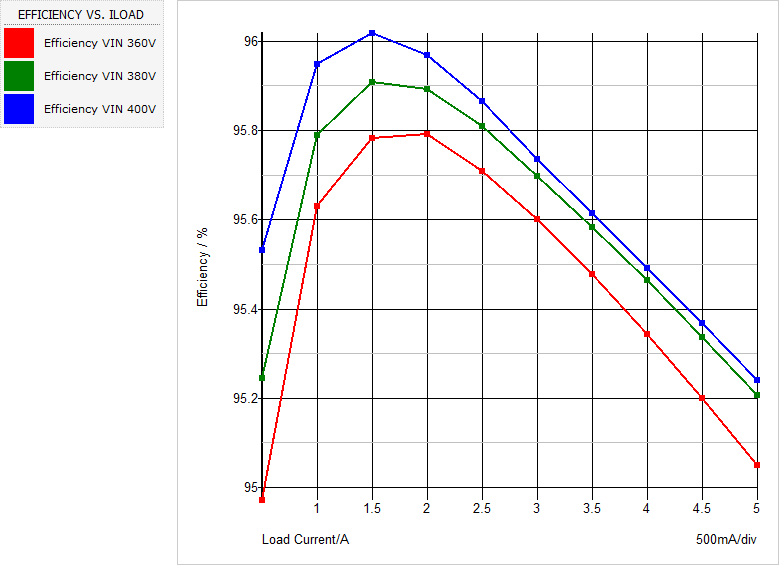
DVM handles setting up these efficiency tests quite easily.
Optimizing the Deadtime for a Synchronous Buck Converter
In this example, the deadtime between the two MOSFETs in a synchronous buck converter is stepped and the efficiency is measured over the entire load range with a fixed input voltage. Two variables are swept - ILOAD and one of the deadtimes, in this case, the delay between turning off the low side MOSFET and the high side MOSFET. The optimum deadtime can be graphically determined on the resulting efficiency curves.
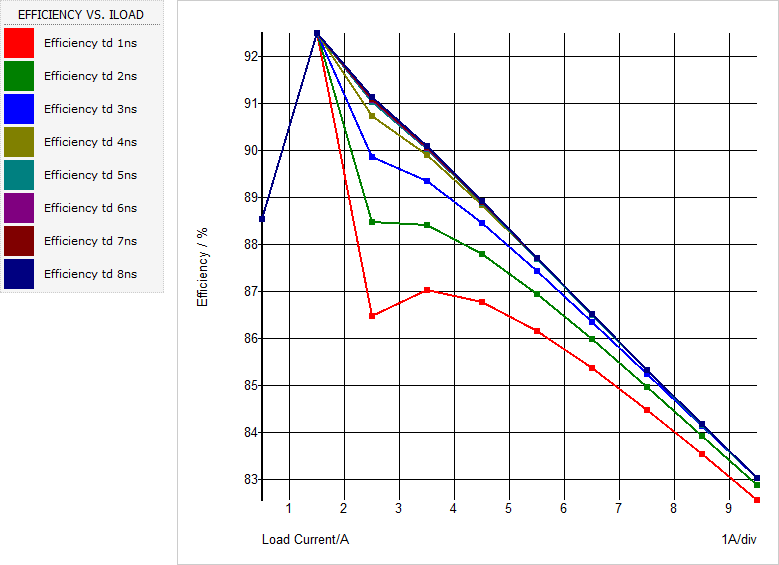
In this example you will see how easy it is to modify the testplan used in the Generating Efficiency Plots with Multi-Step Runs in DVM section to step the deadtime parameter and produce these plots.
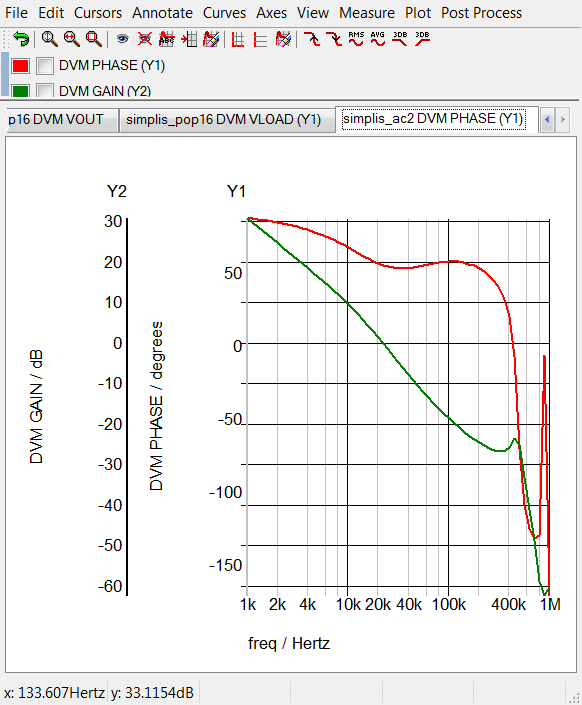
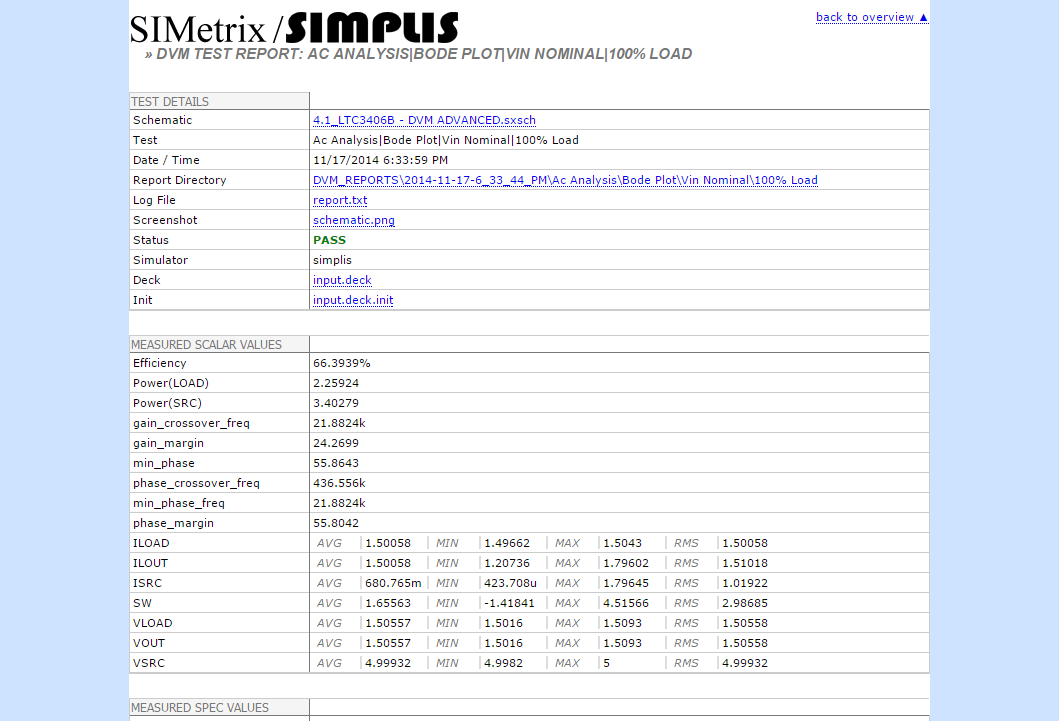
Measuring Control Loop Characteristics over Line and Load
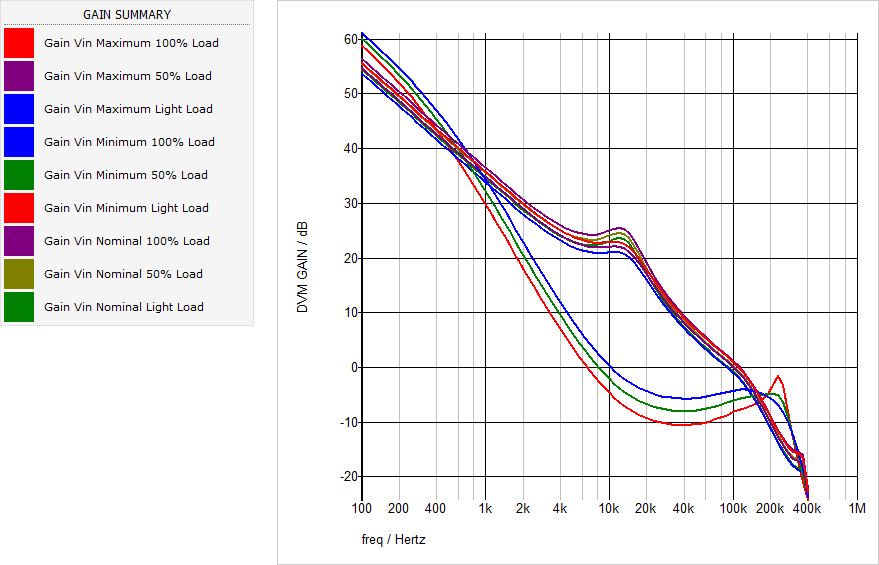
DVM has built-in BodePlot() Test Objective which configures the schematic to measure the loop gain, runs the appropriate AC analysis, generates the loop gain plots and finally makes the gain margin, phase margin, and gain crossover frequency measurements. Repeating this test for different line and load conditions generates a series of Bode Plots and in this example, the light load bode plots show a significantly lower loop bandwidth and improved gain and phase margin. This particular circuit enters into a discontinuous conduction mode at light load; therefore, the double pole in the plant splits and the lower frequency pole dominates the bode plot response.
As with the other examples, the scalar values produced from each run can be plotted on a XY axis. This example plots the gain margin, phase margin, and gain crossover frequency versus the load current, with the input voltage as the running parameter. The three curves correspond to the minimum, nominal, and maximum input voltages.
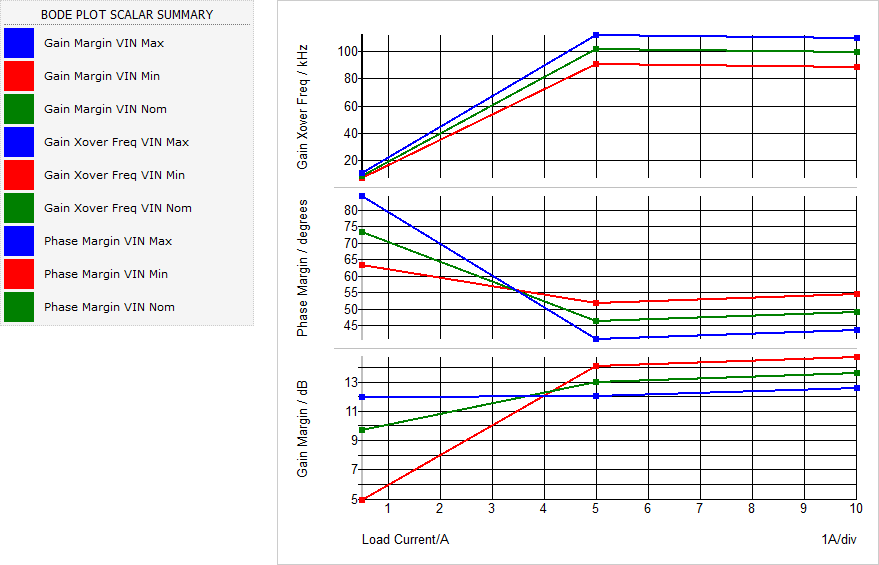
The testplan used to generate these plots uses single step Bode Plot simulation objectives and is taken directly from the built-in testplan for a 1 input/ 1 output converter. Scalar aliases were added to the testplan to generate unique scalar names for each input voltage and a final test extracts the curves from the previous tests and plots the scalar values.
Sensitivity and Worst Case Analysis
DVM has a built-in sensitivity and worst case analysis tool. This example uses the same synchronous buck converter used to optimize the deadtime. The end goal of this sensitivity analysis is to determine the sensitivity of the converter efficiency to deadtime parameter variation.
Worst Case Output Voltage Deviation in Response to a Repeated Load Transient
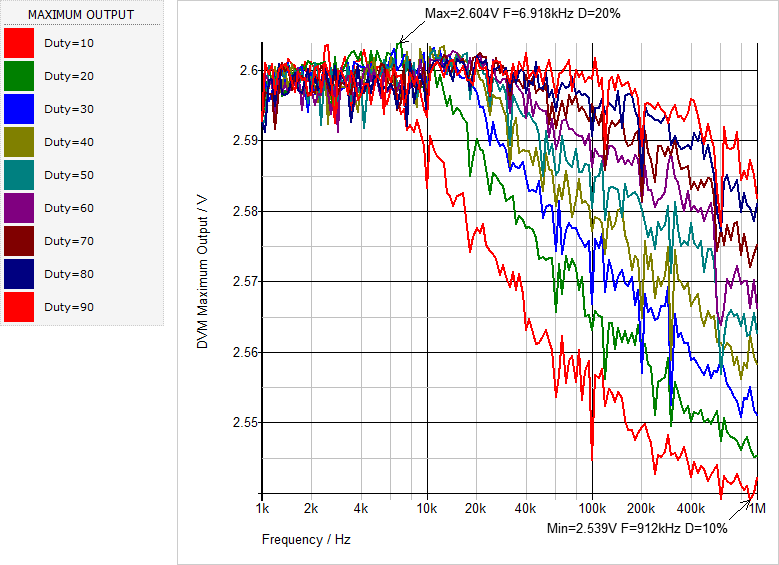
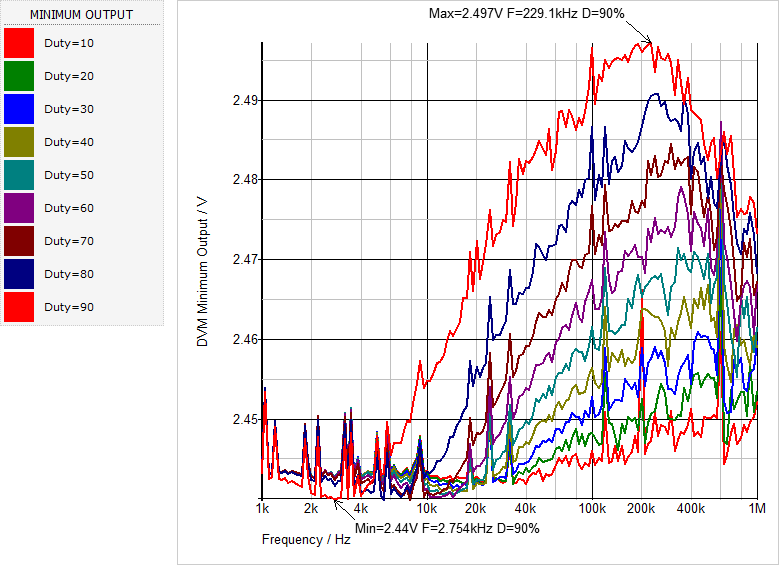
One challenge facing VR controller manufacturers is guaranteeing the minimum and maximum output voltage regulation specification is met when the VR is loaded with a repeated pulse load transient of varying frequencies and duty cycles. This example uses DVM to apply a pulse load transient to the converter with the frequency stepped over a range of 1kHz to 1Meg Hz, with a duty ratio of 10 to 90%.
Because the repeated pulsed load is asynchronous to the converter's switching frequency (which might change with applied load current), it sets up a beat frequency at the converter output. DVM captures enough pulse load periods to accurately measure a representative minimum and maximum output voltage for the particular pulse load frequency and duty cycle. The results can then be plotted on a XY plot similar to the previous examples. In this case the pulse load frequency is plotted on the x-axis and the magnitude of the minimum or maximum output voltage is plotted on the y-axis, with the duty ratio as the running parameter. A total of 151 frequencies and 9 duty ratios are simulated, resulting in a total of 1359 simulation steps.
Conclusions and Key Points to Remember
- DVM offers a framework to automate testing a converter, plotting the results and gathering both graphical and scalar data into a HTML formatted report.
- Extremely complicated test can be run using DVM.
- During the design process, DVM offers a way to optimize a portion of a design, in this topic, the example the deadtime of a converter is used. Almost any design parameter can be optimized in a similar way.
- The sensitivity analysis offers another way to characterize the sensitivity of the design to a particular set of component variations.