Example 3 -- Operational Amplifier with Saturation
The system under study in this example is a simple operational amplifier circuit driven to saturation by a sinusoidal input voltage. 9.7 (a) represents the circuit and 9.7 (b) is the piecewise-linear model of the system.
The operational amplifier is modeled by the input resistance RIN between its differential inputs, the voltage-controlled voltage source EOP, the output resistance ROUT, and the piecewise-linear resistor !RSAT. The purpose of the PWL resistor R1 (!R$R1 in the input file) is to model the saturation of the operational amplifier whenever the output voltage rises above 5V or drops below -5V. Placing the PWL resistor R1 across the output of the opamp is one of many possible ways to model the saturation of an operational amplifier. The variables of interest are the input sinusoidal voltage, the voltage across the differential inputs of the opamp, and the output of the opamp. The SIMPLIS input file defining the piecewise-linear model for the circuit of Example 3 is given in 9.8 and waveforms obtained from this simulation are shown in 9.9 .
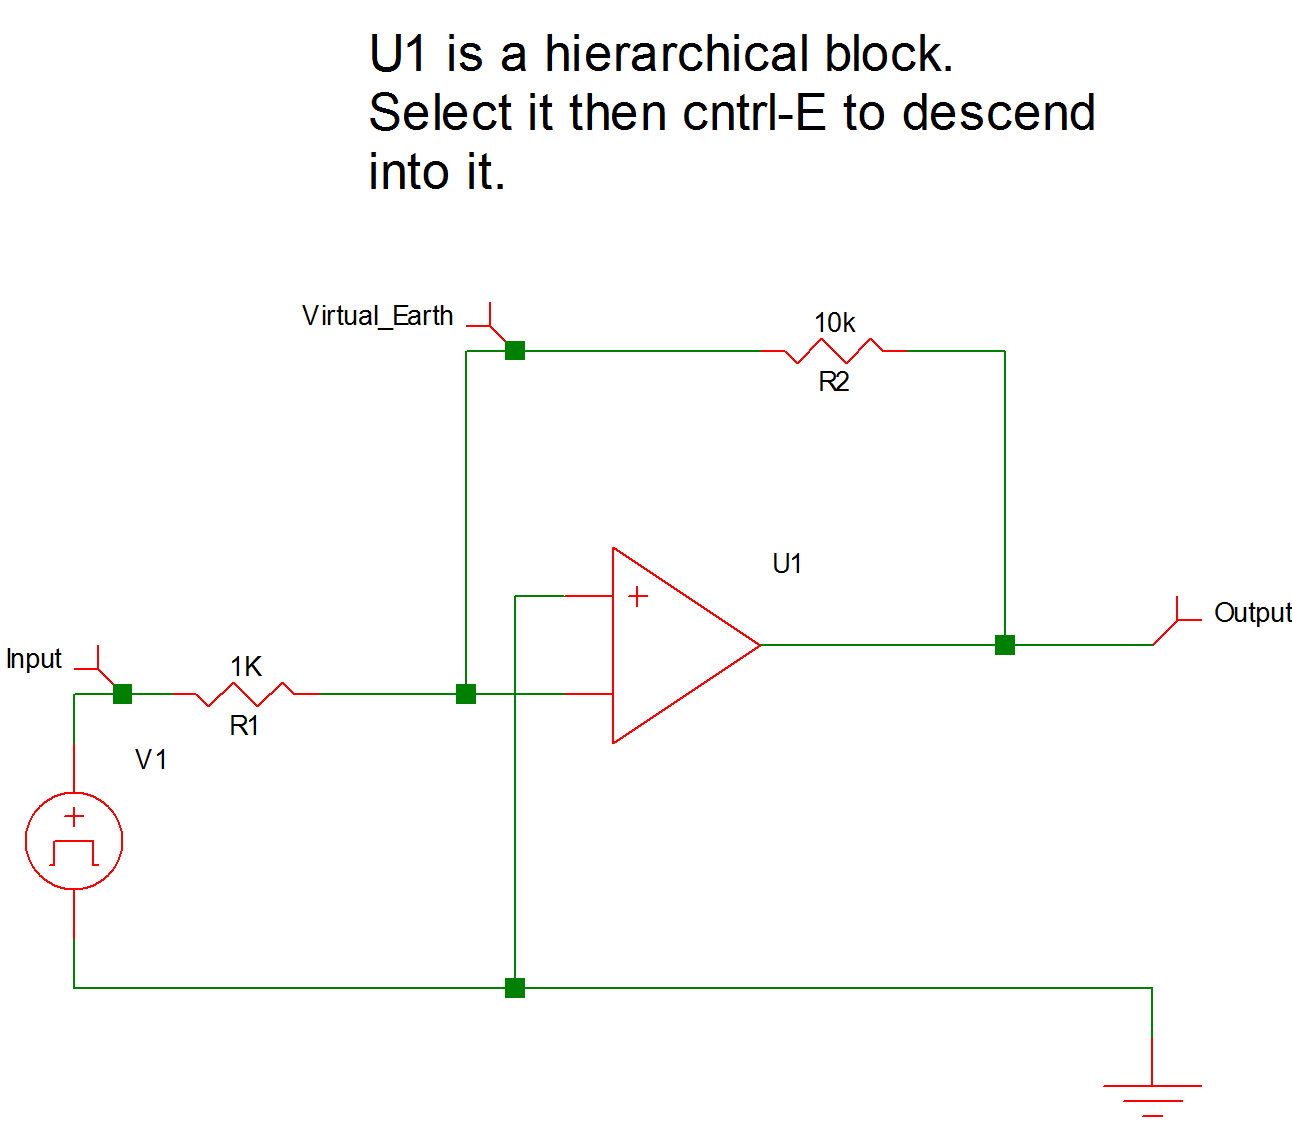 |
9.7a Example 3 Operational Amplifier with Saturation Circuit Diagram |
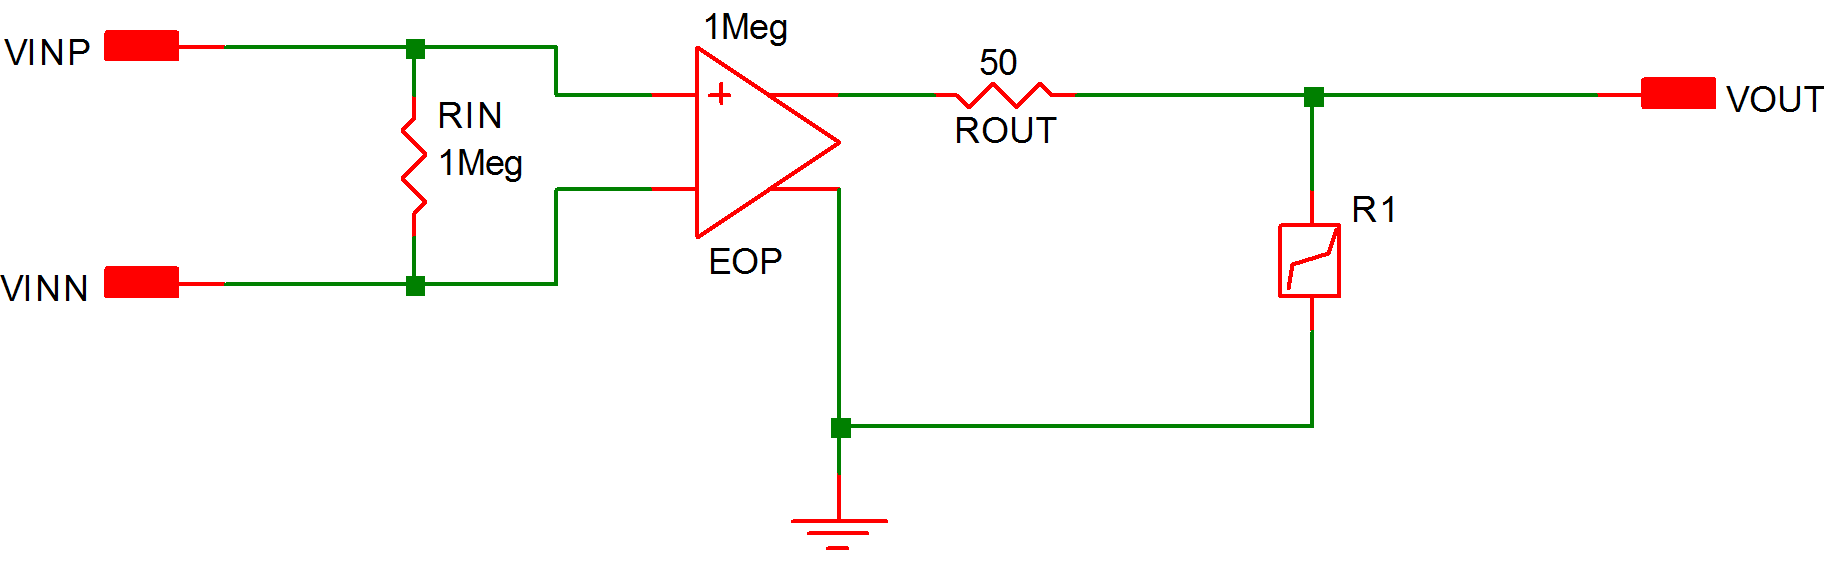 |
9.7b Example 3 Operational Amplifier with Saturation - Piecewise-linear Equivalent Circuit |
* Saturation of an Operational Amplifier
.PRINT  ALL
.OPTIONS  PSP_NPT=1001
.TRAN 2m 0
X$U1 2 0 1 opamp
V1 3 0 SIN VOFFSET=0 APEAK=1 FREQ=1k TDELAY=0
+ OFF_UNTIL_DELAY=NO DAMP_COEF=0
R1 1 3 1K
R2 2 1 10k
.SUBCKT opamp  3 4 2
.NODE_MAP VINN 2
.NODE_MAP VINP 4
.NODE_MAP VOUT 3
RIN 4 2 1Meg
EOP 1 0 4 2 1Meg
ROUT 3 1 50
!R$R1 3 0 R1$TP_SSPWLR IC=1
.MODEL R1$TP_SSPWLR VPWLR NSEG=3 X0=-5.1 Y0=-1MEG
+ X1=-5.0 Y1=-1U X2=5.0 Y2=1U X3=5.1 Y3=1MEG
.ENDS opamp
.END
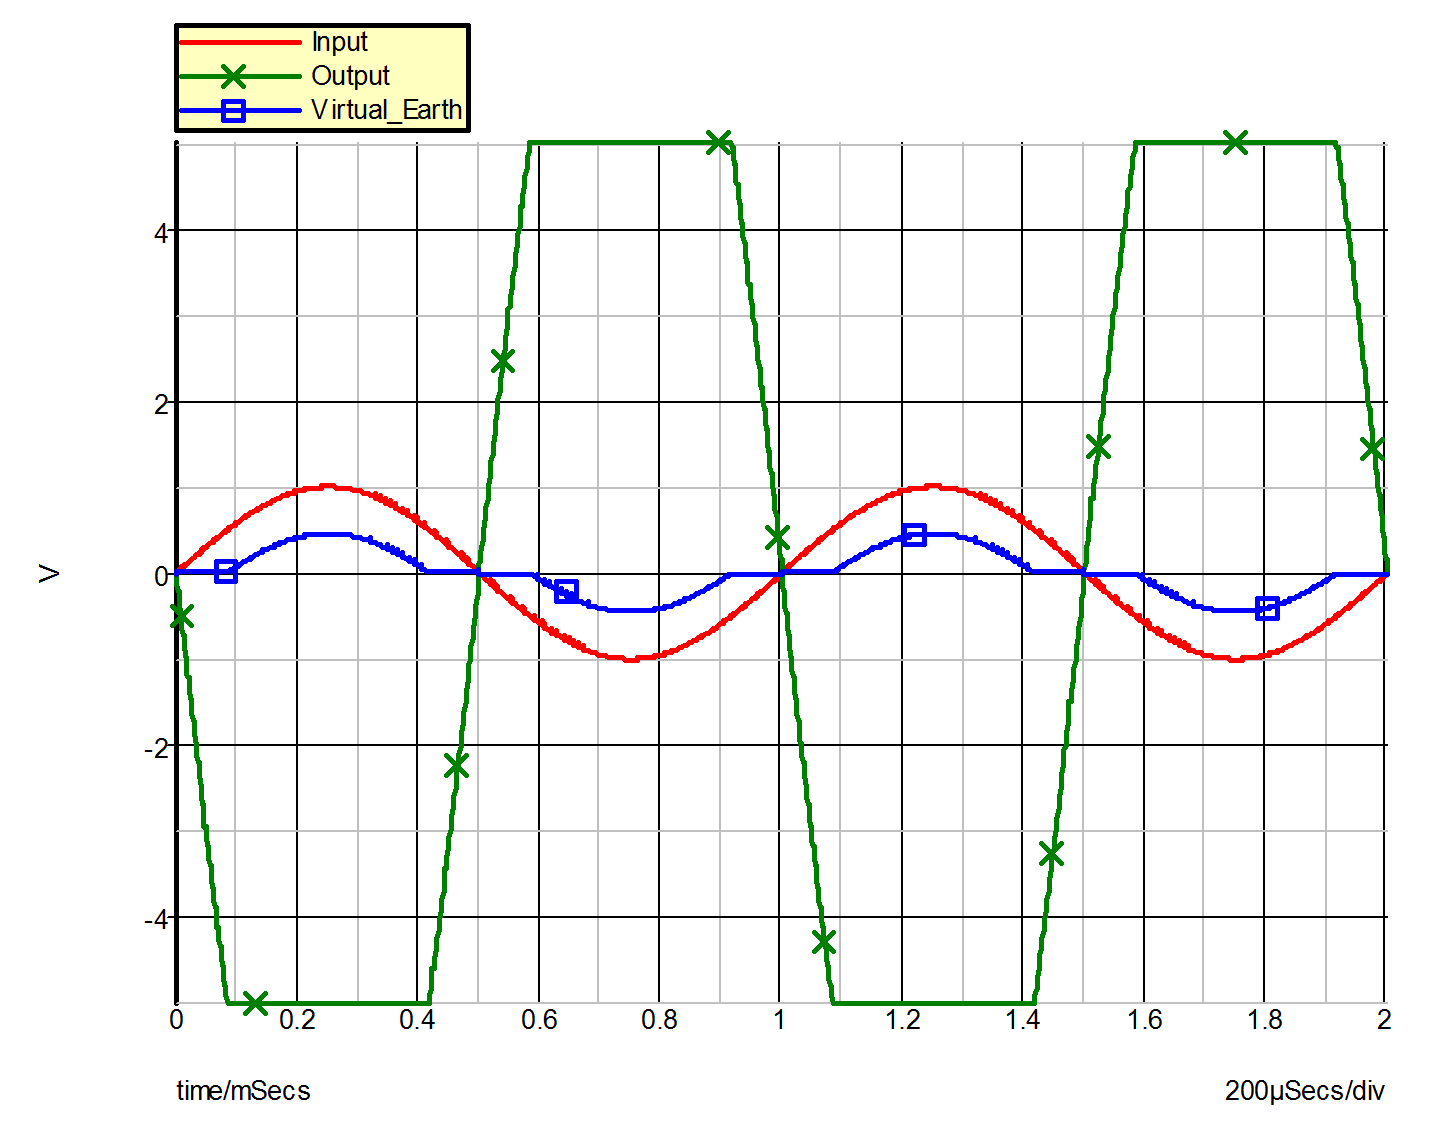 |
9.9 Waveforms for Example 3 |
| ◄ Example 2 -- 3-Phase Rectifier with Resistive Load | Example 4 -- Unregulated Converter ▶ |