2.4.2 Generating Per Cycle Curves
To download the examples for Module 2, click Module_2_Examples.zip
In this topic:
What You Will Learn
- How "Per Cycle" curves can shed light on important details of the converter behavior.
- Per Cycle curves can be generated after a simulation run.
- Fixed probe symbols automatically generate per cycle curves after every simulation run.
Getting Started
- Open the schematic 2.4_SelfOscillatingConverter_POP_Tran.sxsch.
- Press F9 to run the simulation.
Discussion
In switching systems, many important control variables, such as duty cycle or switching frequency, have a single value for each switching cycle. Plotting these values vs. time can often shed new light on the converter operation. For example, when simulating converter topologies with variable frequency operating modes, it is often desirable to plot the frequency of the converter vs. time. Because the switching frequency has a single value fore each period, the vertical value will be constant for each switching period and will change at every switching edge. Consequently, a per cycle curve appears as a stepped waveform. If the converter has a constant frequency, the curve showing the per-cycle frequency would be a flat line.
Exercise #1: Plotting the Frequency of a Gate Drive vs. Time.
- Using the keyboard shortcut Ctrl+P (this only works if you installed the
training scripts in section 1.2.2 Customizing the User Interface) or from
the schematic menu, select Probe ▶ More
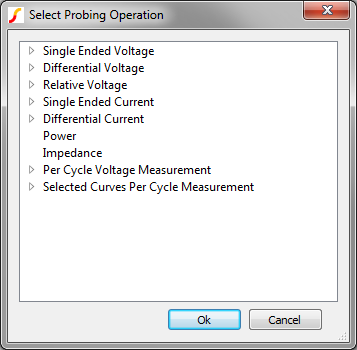
Probe Functions... to open the Select Probing Operation dialog.
Result: The Select Probing Operation dialog opens, displaying the available advanced probing options.
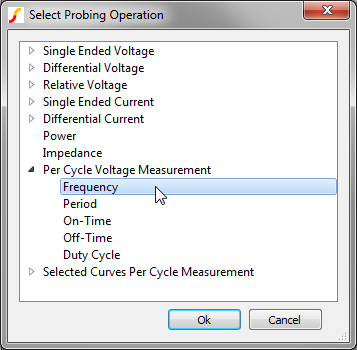
- Double click on the second to the last item - Per Cycle Voltage
Measurement.
Result: The tree expands to show the five timing measurements in this category.
- Select the Frequency item. The dialog should now be configured as below:
- Click Ok. Result: The following dialog opens with further instructions:

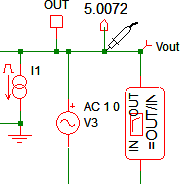
- Click Close.Result: The mouse cursor symbol changes to a probe symbol:

The program now expects you to select the node on the schematic for which you want to plot the Per Cycle Frequency curve.
- Move the mouse cursor over the gate of the primary side MOSFET Q1, and
left click. Result: The Per Cycle Frequency of the Q1 gate voltage is plotted on a new grid:

In the above graph, you can both visualize and easily measure the frequency of the converter during the load step.
- Period
- On-Time
- Off-Time
- Duty Cycle
Exercise #2: Plotting the Average Value of a Voltage vs. Time.
In the design of switching power systems, it is often helpful to be able to plot the average value of a curve for each switching cycle. For example, the duty cycle of the converter has a single value every switching period. Other example measurements which have a single value per switching cycle include:
- Maximum
- Minimum
- RMS
- Mean
In this exercise, you will plot the per-cycle mean value of the output voltage curve. These curve functions operate a little differently than the previous example. The previous example plotted the frequency of a curve, using the same curve to define the edges where the vertical, or y-values will change. This works because the gate curve has very distinct edges which define the switching interval. The output voltage curve differs from the gate curve in that the edge information is not easily accessible in the waveform. For a curve which is devoid of any edge information, SIMetrix/SIMPLIS needs two curves to perform the operation:
- The curve to perform the measurement on. In this case, the output voltage curve.
- An edge source to define the edge transitions where the measured value will change.
Since two curves are being operated on, these measurements require a curve to be selected on the waveform viewer. This curve will be used as the input and you will select the timing curve from the schematic. To plot the Per Cycle Mean value of a curve:
- If you haven't run the simulation, open the schematic 2.4_SelfOscillatingConverter_POP_Tran.sxsch, and then run the simulation.
- To plot the output voltage curve from which you are generating the new Per
Cycle Mean curve, follow these steps:
- From the schematic menu, select Probe - Voltage (New graph sheet)...
- Move the mouse over the output voltage Vout and left click.
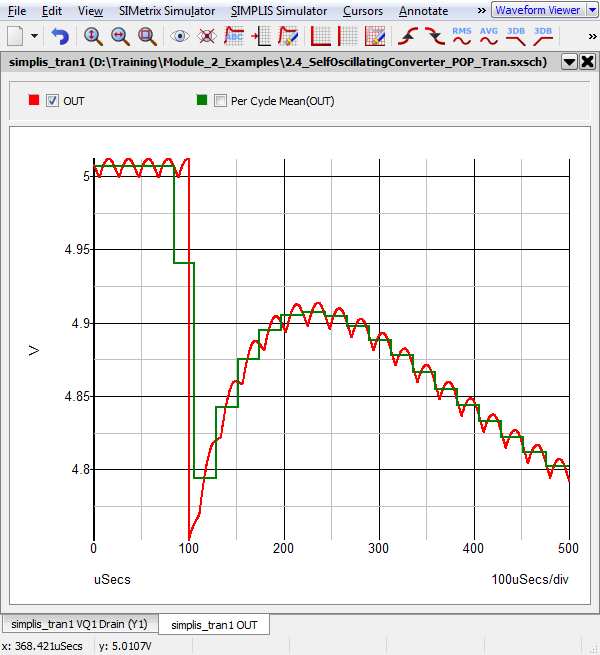
 Result: A new graph tab is opened with the output voltage curve from the Transient analysis. The curve is labeled OUT in the graph legend. This is because the random probing reads the schematic net name, not any probe which is connected to the net.
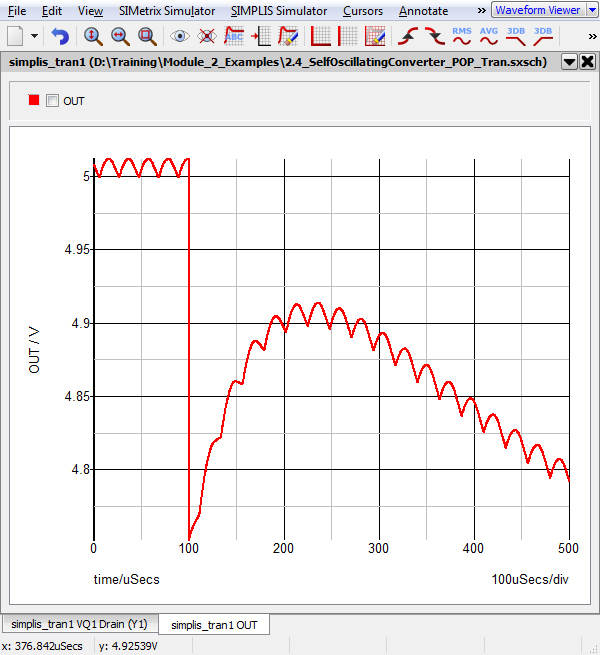
- On the graph legend, check the checkbox next to the OUT curve. Result: The checkbox next to the OUT name should be checked.
- Using the keyboard shortcut Ctrl+P (this only works if you installed
the training scripts in section 1.2.2 Customizing the User Interface) or
from the schematic menu, select Probe ▶
More Probe Functions... to open the Select Probing Operation
dialog. Result: The Select Probing Operation dialog opens, displaying the available advanced probing options.
- Double click on the Selected Curves Per Cycle Measurement.
- Select the Mean entry.
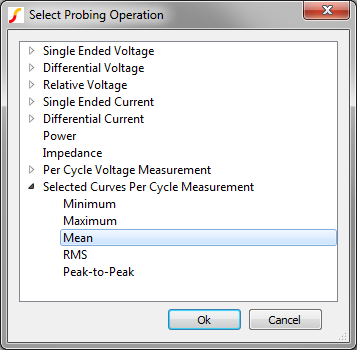
- Click Ok. Result: The following dialog opens with further instructions:
- Click Close.Result: The mouse cursor symbol changes to a probe symbol:
- Move the mouse cursor over the gate of the primary side MOSFET Q1,
and left click. Result: The Per Cycle Mean value of the output voltage is plotted on the same axis as the OUT curve.
Per Cycle Fixed Probe Symbols
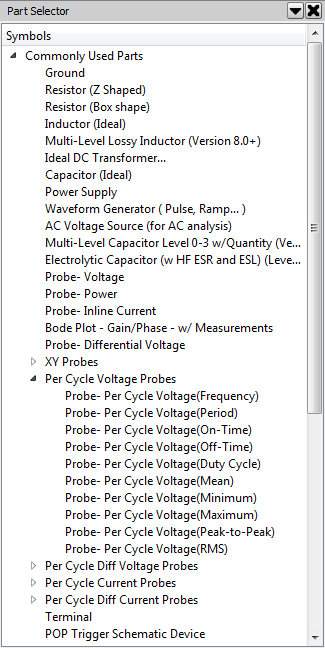
The probing operations described in this topic also exist as fixed probe symbols. These fixed probe symbols allow you to probe voltages, currents, differential voltages or the difference between two currents. Probe symbols exist for each of the five timing measurements and five value measurements described in this topic.
- If the part selector is hidden, run the schematic menu .
- The per cycle probes are located in the Commonly Used Parts section as
shown below:
Conclusions and Key Points to Remember
- Per Cycle Probes give a unique view into circuit operation by plotting these per-cycle variables versus time.
- You can randomly plot per cycle curves using the menu.
- Fixed per cycle probe symbols are located in the Commonly Used Parts section of the part selector.